Does the location of a school have an impact on the attainment of pupils at that school? I recently published a paper on that question, called Lonely schools: the relationship between geographic isolation and academic attainment in Educational Research, looking at the relationship between geographic isolation and pupil’s academic attainment in English secondary schools (Odell 2017). That paper1 used the percentage of all students and disadvantaged students achieving 5+ GCSEs at Key Stage 4 (KS4), including English and maths (5+ A*-C GCSE(EM)), from 2013-2015 as its dependent variable. That analysis identified a correlation between lower GCSE attainment rates by disadvantaged pupils at secondary schools in more geographically isolated areas, when controlling for other school demographic, previous attainment and location variables.
This post uses the same methodology as in that paper, but with the headline measure from the 2016 KS4 results. The results are not directly comparable, as the headline accountability measure changed in 2016, to the ‘Attainment 8’ point score, the student’s average grade across a range of subjects, taken from the 2016 KS4 statistical first release (Department for Education 2017). Although the data relases include the percentage of pupils, including disadvantaged pupils, achieving 5+ A*-C GCSE(EM) at KS4, I decided to use the new headline measure, to see if the negative relationship between a school’s geographic isolation and disadvantaged pupil attainment described in Lonely Schools is still there with a newer (and in my opinion better) measure of school and pupil performance.
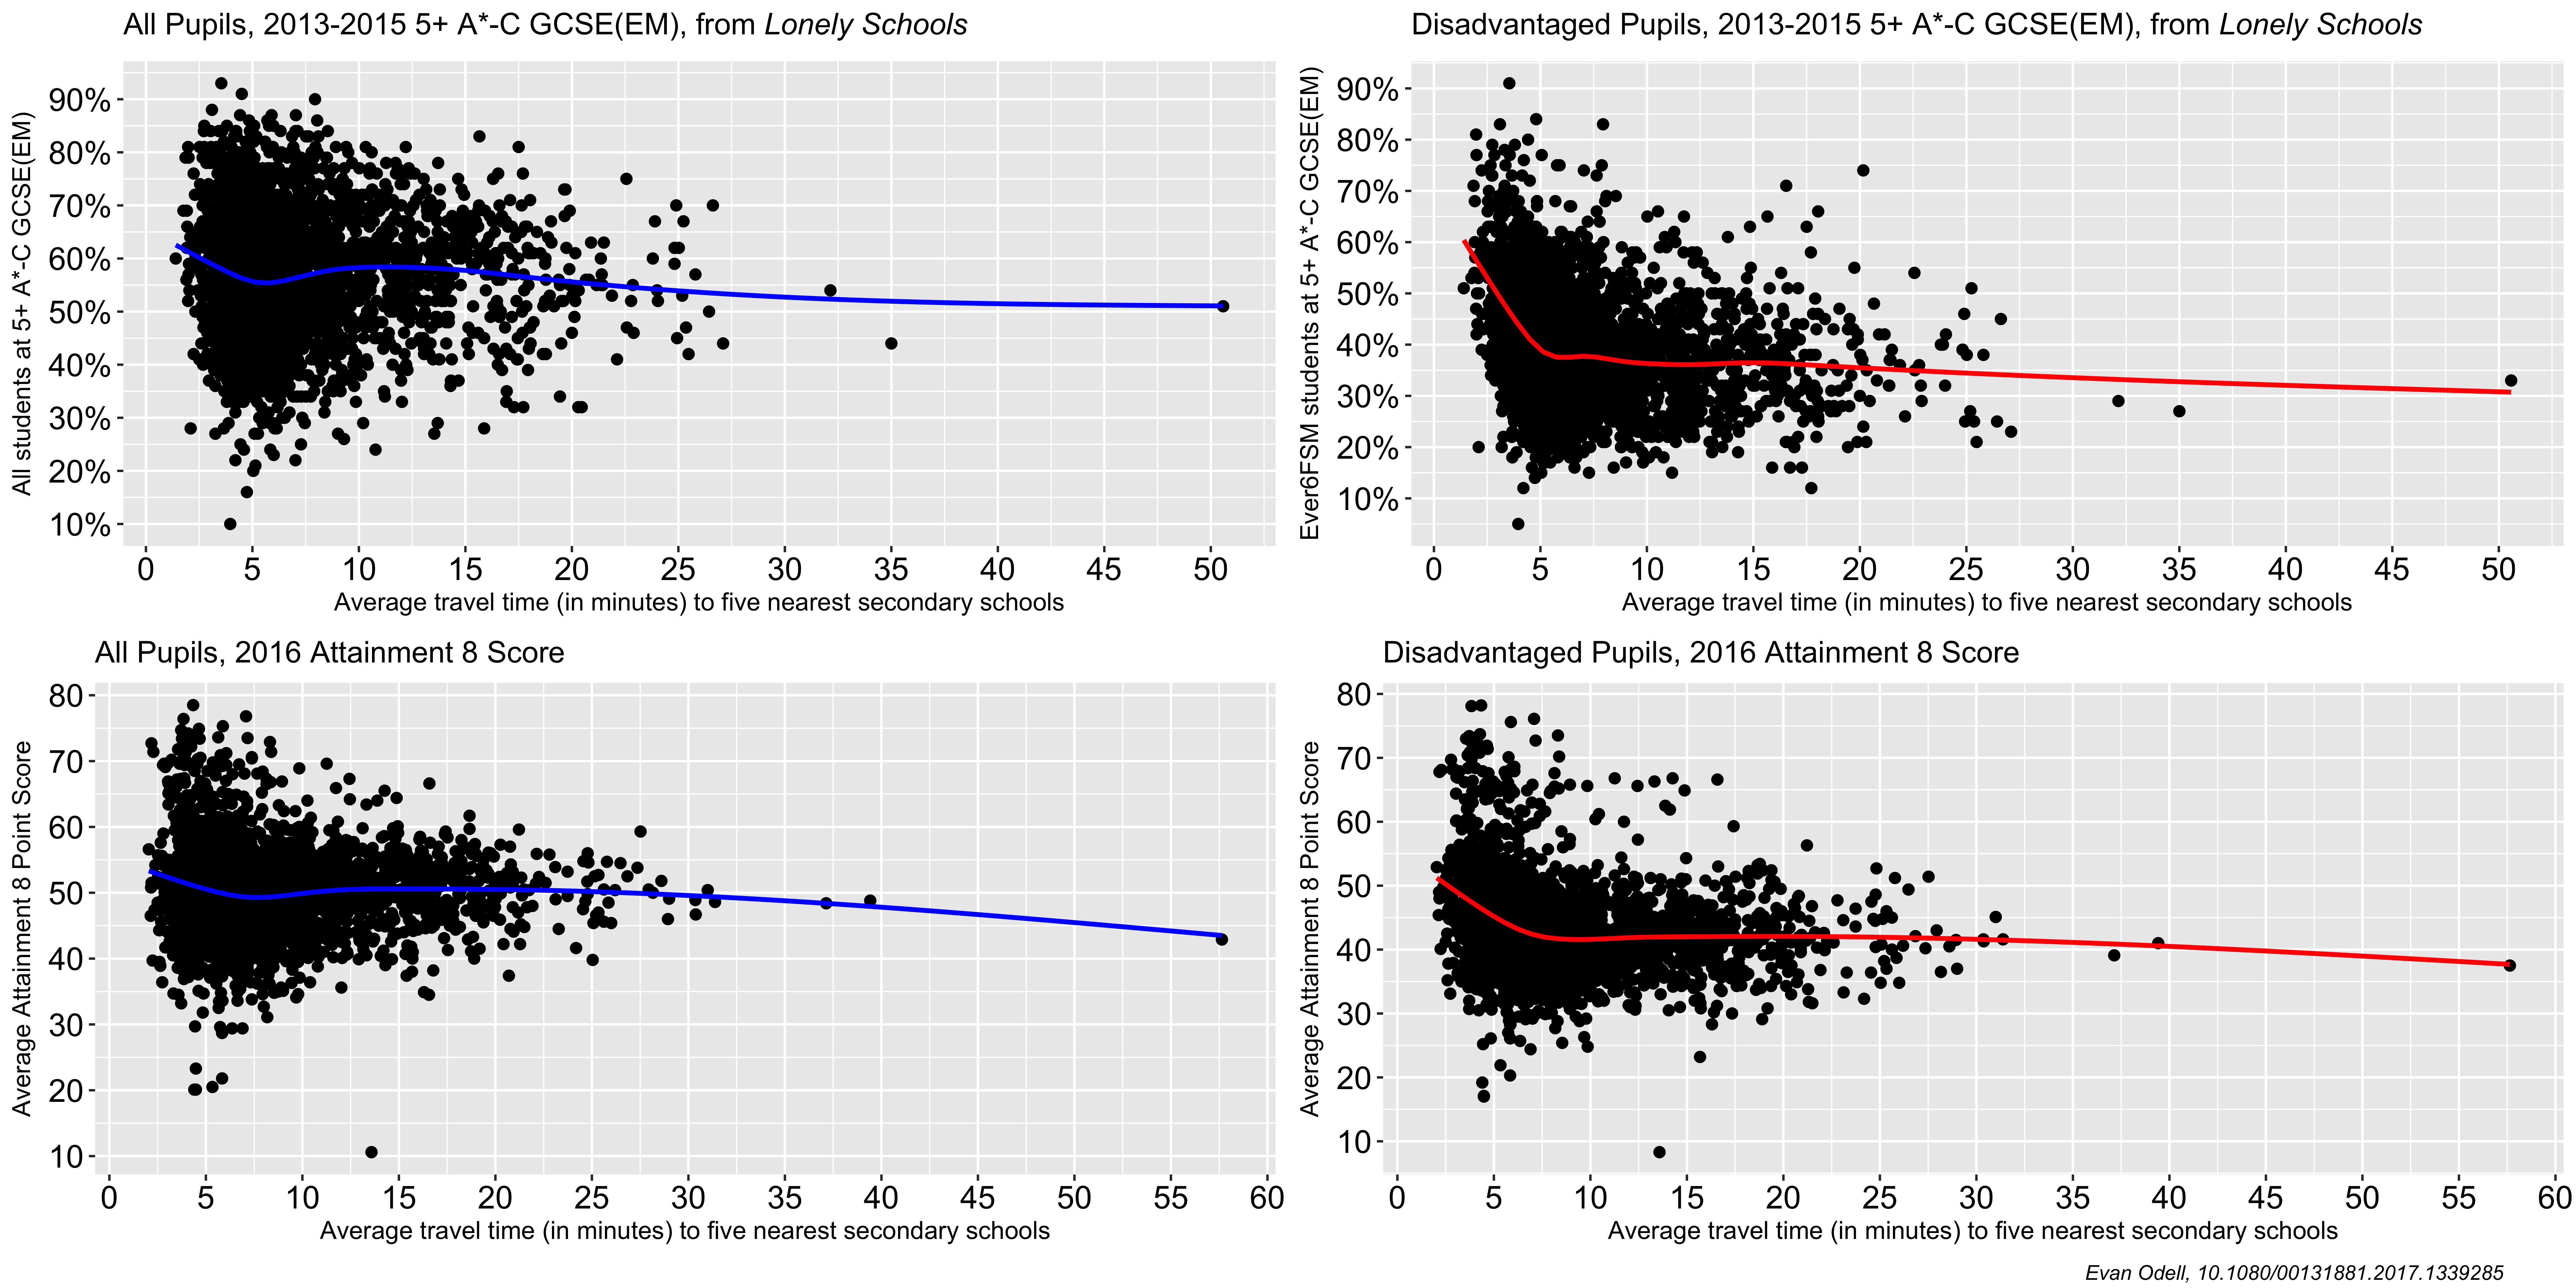
Using 2016 data, the relationship between geographic isolation and academic attainment is muddled, if it is there at all. As in the published paper, there is a substantial correlation between lower disadvantaged pupil attainment and increased geographic isolation, while there is little to suggest a relationship between overall Attainment 8 scores and isolation. This is demonstrated in Table 1, and Figures 1 and 2.
Table 1 - Correlation between Index of Isolation and Attainment 8 score, all pupils and disadvantaged pupils
| All Pupils | Disadvantaged Pupils |
|---|---|
| -0.02186148 | -0.1827152 |
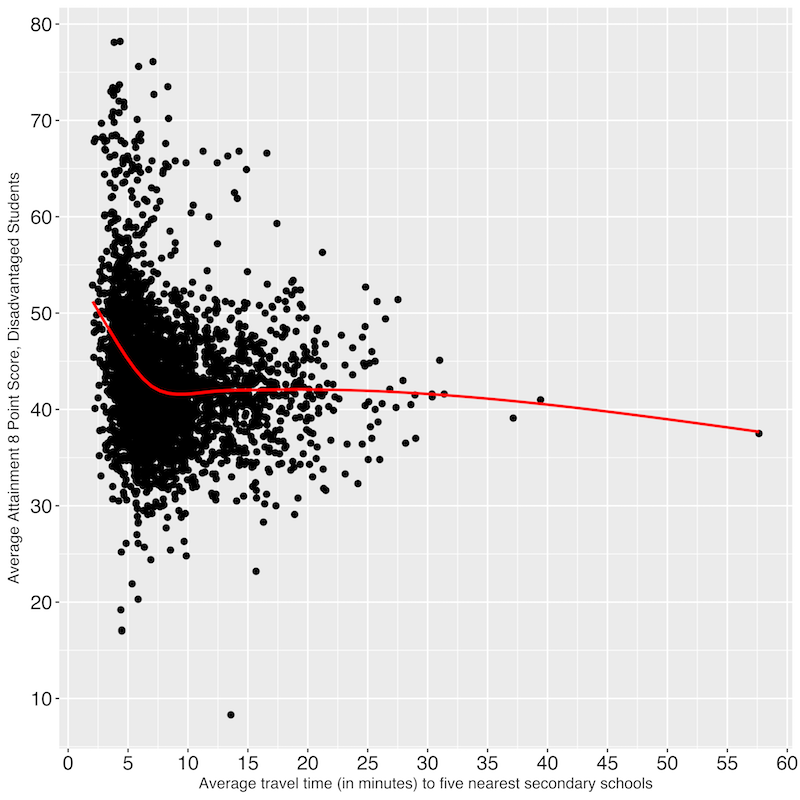
In Figure 1 there is a slight drop in Attainment 8 scores in slightly isolated schools, compared to the least isolated schools, but overall the relationship is very weak, as demonstrated by the correlation’s close proximity to 0. Disadvantaged Attainment 8 scores , meanwhile, sees a substantial drop, losing about 8 points between the least isolated schools and schools just 8 minutes driving time from their 5 nearest neighbours.
Figure 1 - Whole-school Attainment 8 score by Index of Isolation
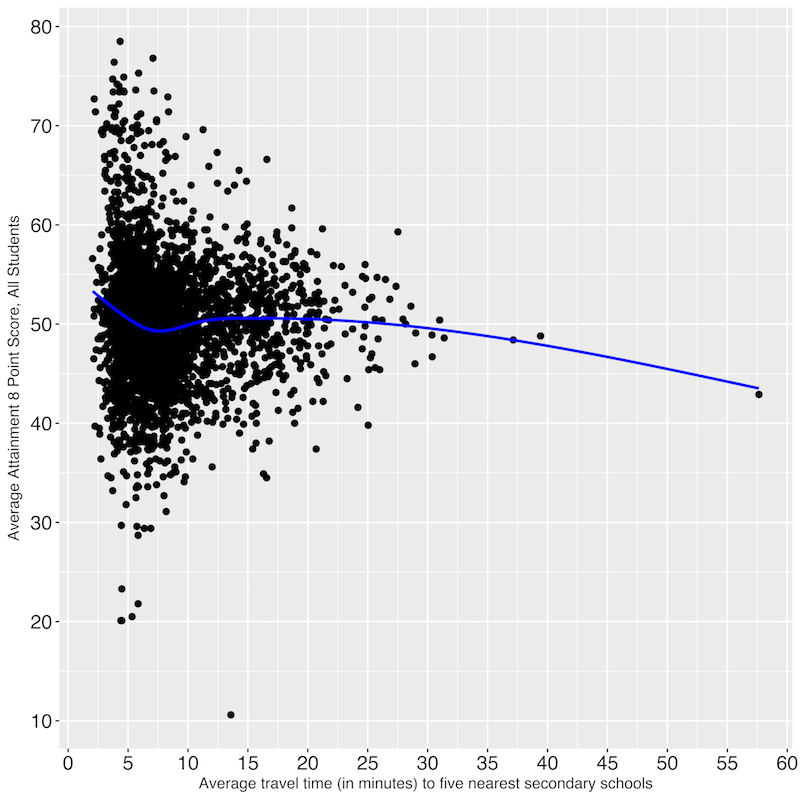
Figure 2 - Disadvantaged pupil Attainment 8 score by Index of Isolation
When controlling for school demographics, the picture becomes much more confused. There are statistically significant relationships between Attainment 8 scores and geographic isolation in Models 3, 4 and 5, but they are all positive, associating geographic isolation with increased Attainment 8 scores for both disadvantaged pupils (Model 4) and all pupils (Models 3 and 5) with some degree of statistical significance (p<0.05). The persistent relationship between increased geographic isolation and lower disadvantaged pupil attainment I found in Lonely Schools is no longer there; instead there is some evidence, albeit weak, that the reverse was true in 2016.
Table 2 - Academic Attainment 8 score by All Pupils and Disadvantaged (Ever6FSM) Pupils
| All Pupils | Ever6FSM Pupils | All Pupils | Ever6FSM Pupils | All Pupils | Ever6FSM Pupils | |
|---|---|---|---|---|---|---|
| Model | Model 1 | Model 2 | Model 3 | Model 4 | Model 5 | Model 6 |
| (Intercept) | -42.613*** | -49.061*** | -41.216*** | -80.685*** | -0.038*** | -0.001 |
| -1.756 | -2.606 | -1.251 | -1.898 | -0.01 | -0.014 | |
| IsoIndex | 0.022 | -0.026 | 0.030* | 0.104*** | 0.021* | 0.024† |
| -0.014 | -0.023 | -0.015 | -0.023 | -0.01 | -0.014 | |
| EVER6FSM | -8.115*** | 3.036*** | -6.854*** | 3.155** | -0.167*** | 0.027 |
| -0.634 | -0.814 | -0.648 | -0.983 | -0.016 | -0.02 | |
| EAL | 6.400*** | 8.768*** | 7.706*** | 10.757*** | 0.233*** | 0.321*** |
| -0.38 | -0.464 | -0.468 | -0.711 | -0.014 | -0.018 | |
| SEN | 6.749* | 2.954 | 4.496 | -14.396** | 0.013 | -0.01 |
| -3.363 | -4.62 | -3.462 | -5.252 | -0.01 | -0.013 | |
| GIRLS | 2.161*** | 1.909*** | 1.711*** | -0.668 | 0.045*** | -0.005 |
| -0.337 | -0.503 | -0.318 | -0.482 | -0.008 | -0.012 | |
| TOTPUPS | 0.001*** | 0 | 0.002*** | 0 | 0.088*** | -0.040** |
| 0 | 0 | 0 | 0 | -0.01 | -0.013 | |
| KS2APS | 3.359*** | 3.240*** | 3.280*** | 4.405*** | 0.725*** | 0.786*** |
| -0.058 | -0.089 | -0.044 | -0.066 | -0.01 | -0.016 | |
| IDACI | -0.951† | 0.972 | -3.541*** | 6.711*** | -0.068*** | 0.100*** |
| -0.545 | -0.735 | -0.56 | -0.849 | -0.011 | -0.014 | |
| London | 1.340*** | 2.238*** | 1.319*** | 1.426*** | 0.197*** | 0.266*** |
| -0.195 | -0.256 | -0.254 | -0.385 | -0.038 | -0.049 | |
| R-squared | 0.769 | 0.503 | 0.891 | 0.835 | 0.891 | 0.595 |
| adj. R-squared | 0.768 | 0.502 | 0.89 | 0.835 | 0.89 | 0.594 |
| sigma | 39.461 | 29.955 | 0.051 | 0.077 | 0.008 | 0.012 |
| F | 1092.827 | 332.939 | 2681.213 | 1666.402 | 2681.213 | 482.764 |
| p | 0 | 0 | 0 | 0 | 0 | 0 |
| Log-likelihood | -7566.581 | -8849.763 | -7907.564 | -9144.297 | -2270.448 | -3159.933 |
| Deviance | 4606185.869 | 2654253.346 | 7.707 | 17.733 | 0.173 | 0.407 |
| AIC | 15155.163 | 17721.526 | 15837.128 | 18310.595 | 4562.896 | 6341.867 |
| BIC | 15221.115 | 17787.478 | 15903.08 | 18376.547 | 4628.848 | 6407.819 |
| N | 2968 | 2968 | 2968 | 2968 | 2968 | 2968 |
†p <0.1; *p <0.05; **p <0.01; ***p<0.001
As in Lonely Schools, Models 1 and 2 use Ordinary Least Squares regressions, Models 3-5 use (Covariate Balancing Propensity Score) CBPS (Fong, Hazlett, and Imai 2015), and Models 5 and 6 have standardised regression coefficients.
What’s Changed?
Different Schools
There are several possible reasons why the results in Lonely Schools looked different when using 2016 data. Lonely Schools used 2,577 secondary schools, and included three years of data, while this analysis used 2,968 schools (391 more than in Lonely Schools, and 508 schools not included in Lonely Schools2), and those newly included schools could have influenced the result.
New Measurements
Another reason is the difference in dependent variables. Both analyses used the headline accountability measure used by the DfE, but that measure changed for 2016. The 5+ A*-C GCSE(EM) measure represents the percent of pupils to get above a given threshold; a pupil with 5 C grades is worth the same as a pupil with 10 As. The Attainment 8 measure, meanwhile, means that the pupil with 10 As will have a substantial positive effect on their school’s score, much greater than that of the pupil with 5 Cs. Any performance indicator will produce changes in school behaviour (Wilson, Croxson, and Atkinson 2006), and the 5+ A*-C GCSE(EM) measure produces some unique behaviour and grade patterns, with student grade clusters peaking just above a C. Schools may not yet have adjusted their behaviour to account for this new performance measure, and even if they have, the measurement rewards a more equal application of resources amongst students; Attainment 8 rewards schools that can get B students into an A range, and E students into the D range.
_Figure 3 - Whole-school Attainment 8 score compared to whole-school 5+ A*-C GCSE(EM)_
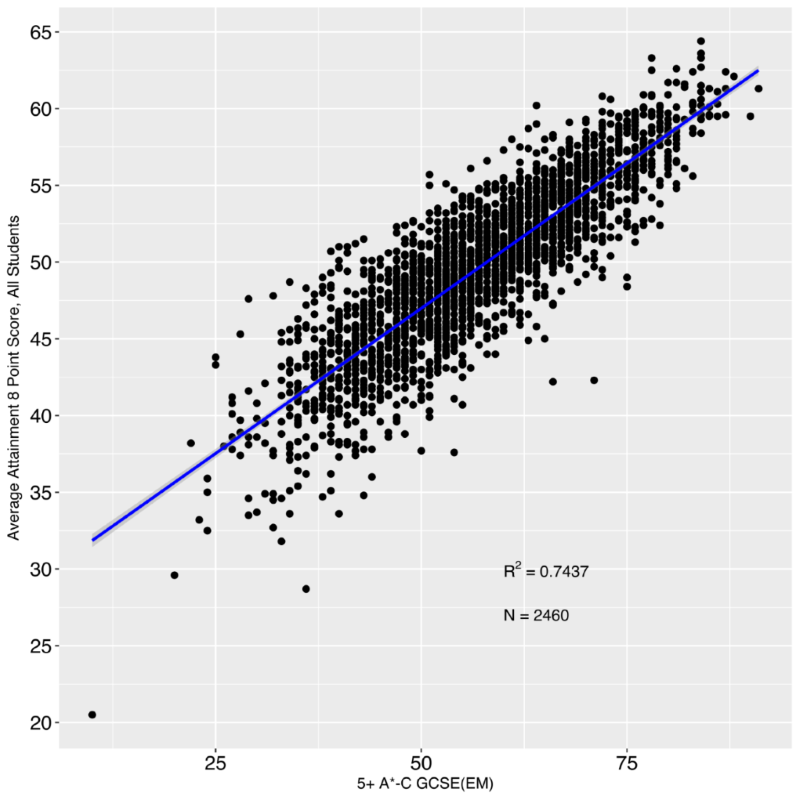
_Figure 4 - Disadvantaged Attainment 8 score compared to disadvantaged 5+ A*-C GCSE(EM)_
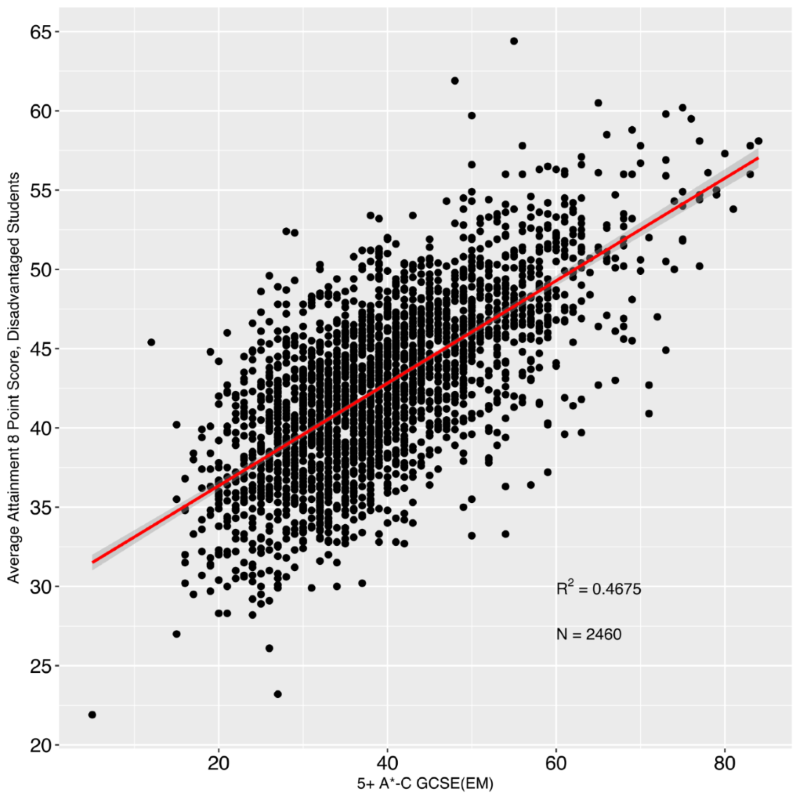
As seen in Figures 3 and 4 above, there is a much stronger relationship between Attainment 8 scores and 5+ A*-C GCSE(EM) rates for all pupils than for disadvantaged pupils, although that may be the result of the smaller number of disadvantaged pupils, and thus more extreme cases will have more of an impact.
School Demographics
Figures 1 and 2 above look very similar to the same figures on pages 11 and 13 of Lonely Schools.3 It is only after controlling for demographics and using CBPS that there are statistically significant differences in the 2016 data.
Red Herrings
The final possibility, and the one that I think is the most important to consider, is that there is no direct relationship between pupils’ academic attainment and the geographic isolation of the school they attend; there is nothing about geographic isolation itself that reduces (or increases) pupil attainment. There are well documented regional variations in academic attainment in the English education system {% cite wilshaw2015 departmentforeducation2016b –file isolated %}, and geographic isolation is simply a proxy for the regional variations in some of the various factors – social, economic, cultural, demographic, etc – that can produce variations in educational attainment.
Moreover, geographic isolation is not really a solvable problem. There are policies that can ameliorate potential challenges posed by geographic isolation (such as pay bonuses to entice teachers to underserviced areas), and improving transportation – particularly public transportation – would make these schools easier to get to. And as the analysis in this blog demostrates, the relationship between geographic isolation and disadvantaged pupil attainment may be positive, not negative, once other variables are accounted for.
Conclusion
What does this analysis reveal about the findings of Lonely Schools? It certainly does not invalidate them, seeing as it only uses a single year of data, and a new method of measuring pupil achievement. What it does show is the importance of having substantial amounts of evidence before making policy. Although there has not been any policy formulated or changed because of the findings of Lonely Schools,4 making any policy decisions on the basis of a single study would be an incredibly poor decision. Any relationships and correlations identified by a single study should be taken with a grain of salt, and not form the basis of any major policy decision.
So is there any relationship between geographic isolation and pupil attainment, disadvantaged or otherwise? Probably not. Rather, schools in isolated areas have differences in pupil demographics – socio-economic, ethnic, cultural, etc – that contribute to their lower disadvantaged pupil attainment, compared to pupils in more school-dense areas. It is demographics, not location, that matters.
Notes
The code used in this blog and in Lonely Schools is available on GitHub.
Department for Education. 2017. “Revised GCSE and Equivalent Results in England: 2015 to 2016.” Statistical First Release SFR 03/2017. Statistics: GCSEs (Key Stage 4). London: Department for Education. https://www.gov.uk/government/statistics/revised-gcse-and-equivalent-results-in-england-2015-to-2016.
Fong, Christian, Chad Hazlett, and Kosuke Imai. 2015. “Covariate Balancing Propensity Score for General Treatment Regimes.” http://imai.princeton.edu/research/files/CBGPS.pdf.
Odell, Evan. 2017. “Lonely Schools: The Relationship Between Geographic Isolation and Academic Attainment.” Educational Research 59 (3): 257–72. https://doi.org/10.1080/00131881.2017.1339285.
Wilson, Deborah, Bronwyn Croxson, and Adele Atkinson. 2006. “’What Gets Measured Gets Done’: Headteachers’ Responses to the English Secondary School Performance Management System.” Policy Studies 27 (2): 153–71. https://doi.org/10.1080/01442870600637995.
Lonely schools: the relationship between geographic isolation and academic attainment can be accessed here if you have a subscription or institutional access. If not, you can access a copy of the submitted manuscript here. ↩
Some schools closed or converted into academies and thus changed their URNs. This analysis does not include those schools.↩
See the similarity in curves between the plots from 2013-2015 (top) and 2016 (bottom). All four compare the headline accountability measure (y axis) to average travel time to five nearest secondary schools (x axis). Click the image for a larger graph.
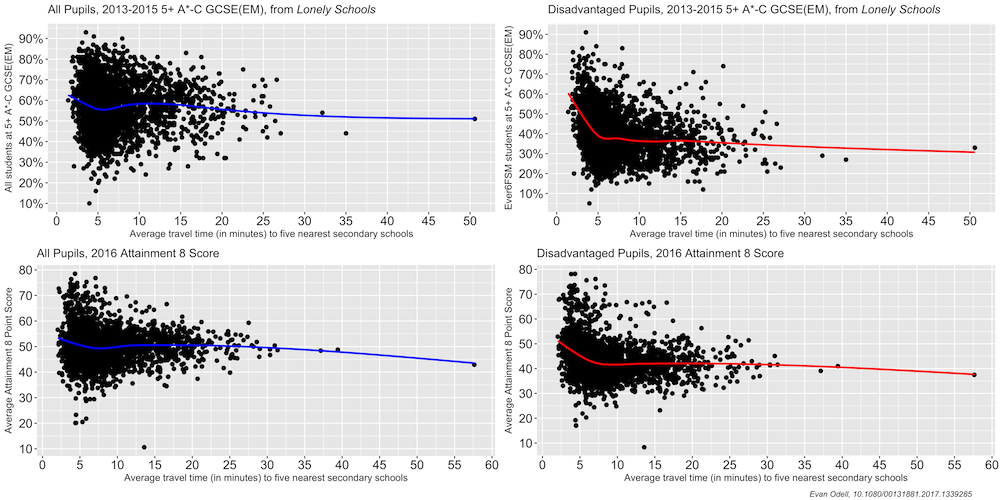 ↩
↩I should be so lucky.↩