Does coffee make us free? Do free people drink more coffee? The European enlightenment has been linked to the introduction of tea and coffee from Asia and the Middle East and the rise of coffeehouse culture, as it displaced beer and wine as the daytime drink of choice, and as people were no longer slightly drunk all the time, they began to ask more critical questions about the societies they were living in.
Most coffee consumption is by people living in advanced capitalist economies, and coffee producing states (who generally consume very little) tend to be part of the poorer global south. But is there a relationship between coffee and freedom, or coffee and democracy? There are loads of different methods political scientists have used to quantify freedom (or various components of freedom) around the world, and I’ve picked five different indices to compare to coffee consumption:
The Economists Intelligence Unit’s Democracy Index (2017), focused on democratic institutions and government.
The World Index of Moral Freedom by the Spanish libertarian think-tank Foundation for the Advancement of Liberty (Kohl and Pina 2016), focused on state influence on personal moral decisions.
The Press Freedom Index published by Reporters without Borders (2017), examining editorial independence, media plurality and violence against journalists.
The Freedom in the World dataset from Freedom House (2018).
The Polity IV dataset produced by the Political Instability Task Force (Marshall, Gurr, and Jaggers 2017).
None of these indicators are perfect, as they provide numerical scores to give the illusion of objectivity, despite them necessarily requiring a high degree of subjective analysis, and are all produced by organisations that either have an explicit political and philosophical standpoint, or are funded by such an organisation, such as the CIA-funded Political Instability Task Force that produces Polity IV. The exact methodology and raw data used in these indices is often not readily available. Likewise, there is no widely agreed-upon definition of what freedom actually is and these indices only capture part of any definition of a free society; for example the Democracy Index’s focus on democracy and democratic institution would at best only capture part of what makes a free society. However imperfect, these indices do allow for some degree of useful comparative analysis; declaring Ireland and Canada to both be equally democratic, more democratic than Australia and Switzerland, but less democratic than Denmark and New Zealand, as the Democracy Index does, seems somewhat dubious, but describing all those countries as being far more democratic than, e.g., Iran, is effectively indisputable.
I took coffee consumption data is from the US department of agriculture and the International Coffee Organization (ICO), and measured in grams per capita per year, using World Bank population estimates, accessed with the wbstats R package and from here. The consumption for EU countries for 2014–2016 is an estimate, based on their individual share of EU consumption in previous years. Note that Luxembourg is unusually high for coffee consumption per capita, drinking almost twice as much coffee per person as Finland, the second highest country.
For each index I present a graph comparing its score to coffee consumption in 2016, highlighting the ten highest coffee drinking countries. I then use regression analysis to include the wealth of a country, using purchasing power parity (PPP) per capita data from the World Bank. For single year indices I use ordinary least squares regressions, for indices with multiple years I used fixed effect panel analyses.
Single Year Indices
Both the EIU Democracy Index and the World Index of Moral Freedom dataset cover only one year, 2017 for the Democracy Index and 2016 for the WIMF. I’ve compared both to coffee consumption in 2016, the latest year available for EU countries from the ICO. The single year of data means that the statistical analyses presented are ordinary least squares regressions, rather than the multi-level panel analyses used in the multi-year indices below.
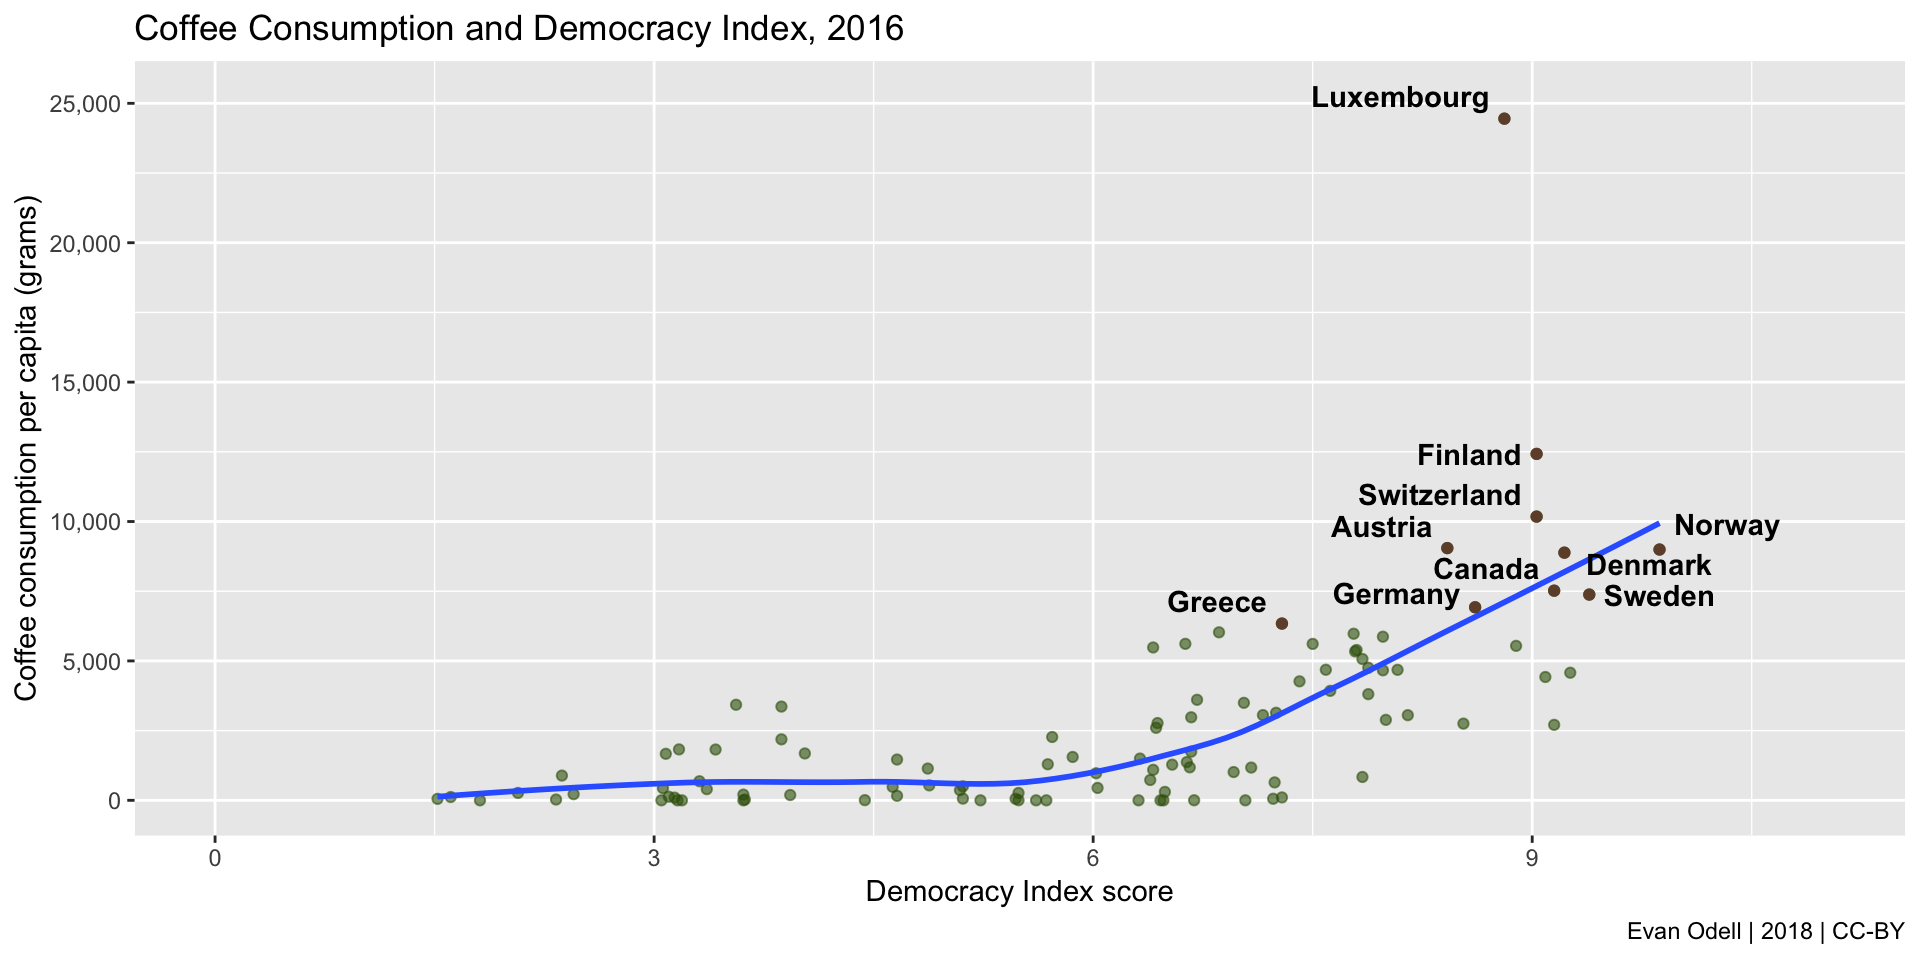
Democracy Index
The Democracy Index scores nations on a scale of 0-10 across five areas: Electoral process and pluralism, Functioning of government, Political participation, Political culture, and Civil liberties. The overall score, used in this analysis, is an average of those five scores.
Democracy Index plot
Democracy Index regression analysis
##
## Call:
## lm(formula = consumption_capita ~ eiu_score + ppp_capita, data = eiu_comp2)
##
## Residuals:
##     Min      1Q  Median      3Q     Max
## -8272.5 -1228.3  -156.7   979.6 12330.4
##
## Coefficients:
##               Estimate Std. Error t value       Pr(>|t|)
## (Intercept) -1624.0991   747.6425  -2.172         0.0322 *
## eiu_score     320.8935   147.8337   2.171         0.0323 *
## ppp_capita      0.1150     0.0166   6.928 0.000000000421 ***
## ---
## Signif. codes:  0 '***' 0.001 '**' 0.01 '*' 0.05 '.' 0.1 ' ' 1
##
## Residual standard error: 2285 on 100 degrees of freedom
## Multiple R-squared:  0.5769, Adjusted R-squared:  0.5684
## F-statistic: 68.17 on 2 and 100 DF,  p-value: < 0.00000000000000022
There is a significant positive relationship between higher WIMF scores and coffee consumption when controlling for purchasing power parity.
World Index of Moral Freedom
The World Index of Moral Freedom (WIMF) uses scores of 0–100 across five indicator areas: Religion, Bioethics, Drugs, Sexuality, and Gender and the Family, with the overall score being an average of those five indicators. It focuses on what the Foundation for the Advancement of Liberty calls “moral coercion” by the state, covering topics like censorship, religious freedom, state secularism and abortion rights, amongst others. This is the most dubious of the five indicators I’ve looked at – it does not appear to be widely used, the organisation that produced it has a very clear agenda, and many of the indicators would vary within some countries as much as between different countries. For example, in federal states like Canada or the USA, many decisions such as drug (de)criminalisation, alcohol sales, abortion access, same-sex marriage and the legal rights of non-married couples is determined as least partially by sub-national governments.
World Index of Moral Freedom plot
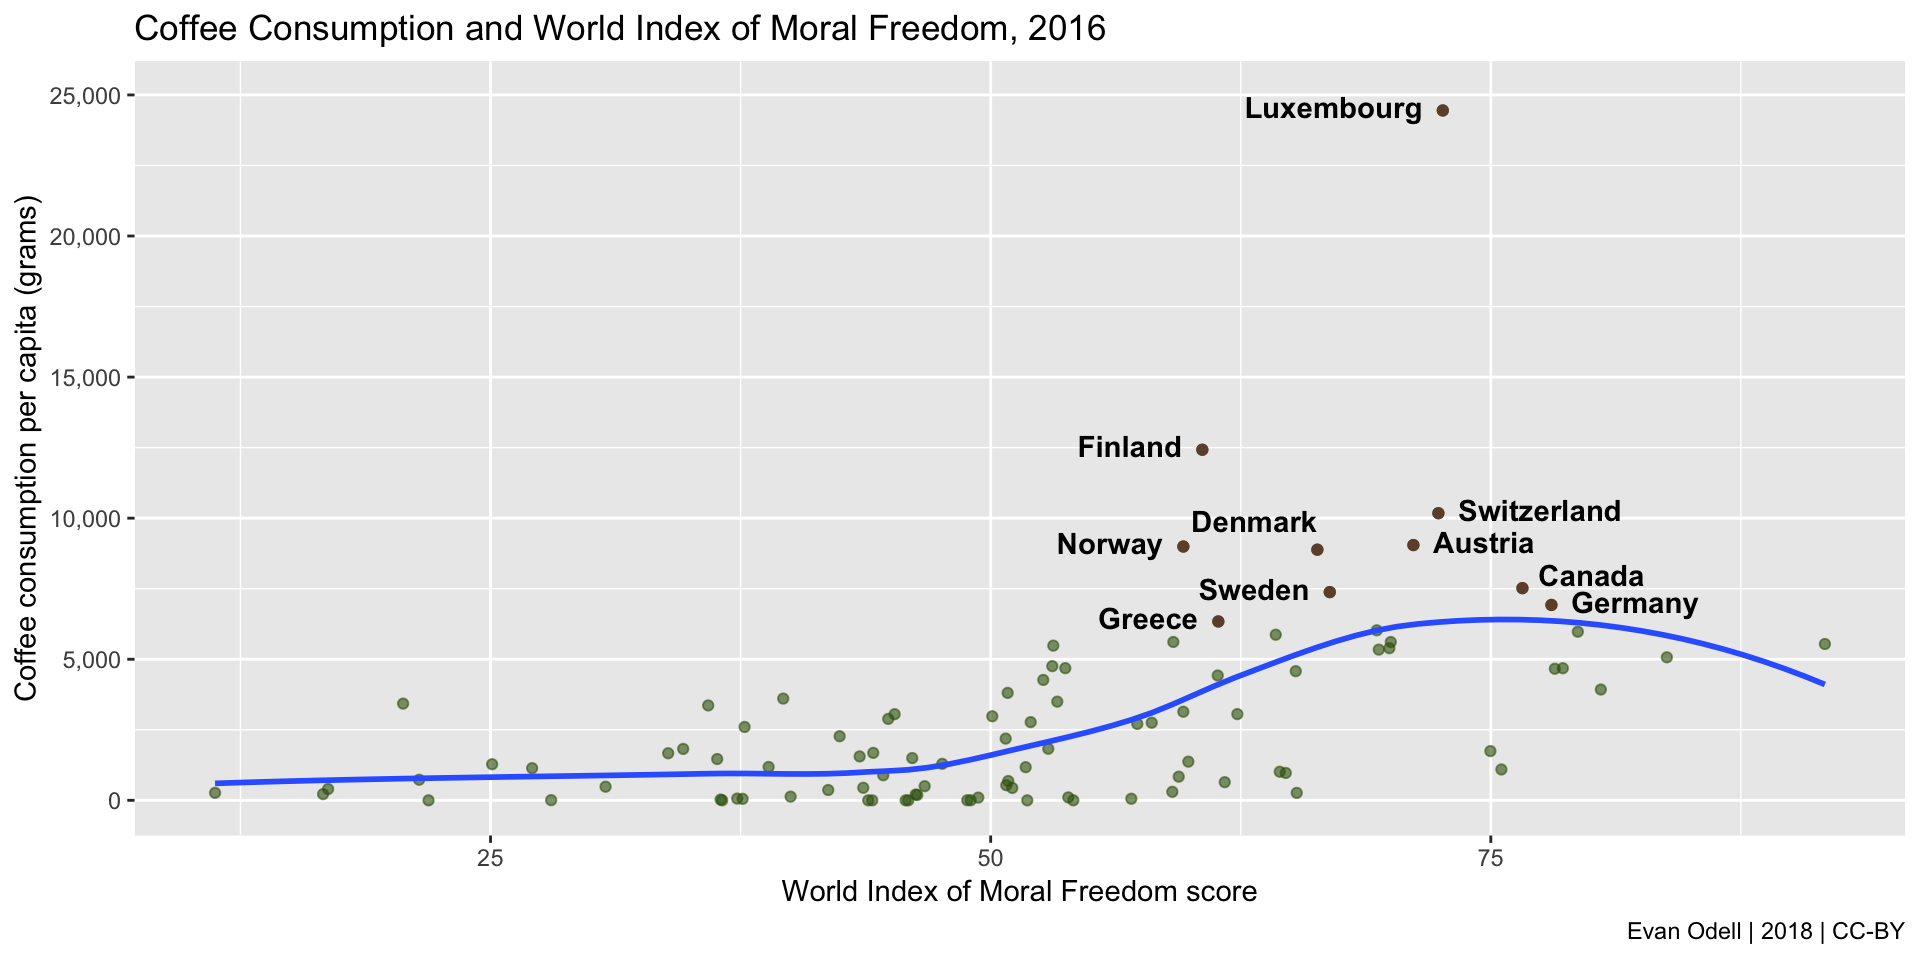
The WIMF is unusual in that it clearly shows six countries: the Netherlands, Portugal, the Czech Republic, Belgium, Spain, and the United States with high WIMF scores and low coffee consumption. Uruguay also scores highly – 2nd, behind the Netherlands – but I don’t have data on coffee consumption in Uruguay. The WIMF is the only indices where at least one of the five highest scoring countries is not also a top-ten coffee drinking country. Whereas six countries in the top ten of the EIU Democracy Index (Including the two highest scorers Norway and Sweden) are also in the top ten of coffee consumption per capita, only two countries are in the top ten of the WIMF and coffee consumption: Canada and Germany.
World Index of Moral Freedom regression analysis
Because I only have one year of moral data, I’m using an ordinary least squares regression.
##
## Call:
## lm(formula = consumption_capita ~ wimf_score + ppp_capita, data = moral_comp2)
##
## Residuals:
##     Min      1Q  Median      3Q     Max
## -8396.5 -1201.9  -174.0   992.9 11916.4
##
## Coefficients:
##               Estimate Std. Error t value         Pr(>|t|)
## (Intercept) -1724.7705   824.2006  -2.093           0.0391 *
## wimf_score     37.9059    17.5654   2.158           0.0335 *
## ppp_capita      0.1212     0.0155   7.821 0.00000000000848 ***
## ---
## Signif. codes:  0 '***' 0.001 '**' 0.01 '*' 0.05 '.' 0.1 ' ' 1
##
## Residual standard error: 2368 on 92 degrees of freedom
## Multiple R-squared:  0.5613, Adjusted R-squared:  0.5518
## F-statistic: 58.86 on 2 and 92 DF,  p-value: < 0.00000000000000022
There is a significant positive relationship between higher WIMF scores and coffee consumption when controlling for purchasing power parity. However, as seen in the plot above, the relation between coffee consumption and WIMF score is not necessarily very linear.
Multi-Year Indices
For multi-year I used fixed effect panel analyses with scaled coefficients to test the relationship between coffee consumption and freedom while controlling for PPP per capita.
World Press Freedom Index
The World Press Freedom Index (WPFI) is released every year by Reporters Without Borders. It scores countries on a scale of 0-100, with 0 being the most free and 100 being the least free. It uses 7 indicators: Pluralism, Media independence, Environment and self-censorship, Legislative framework, Transparency, Infrastructure and Abuses. It then weights these indicators and produces two scores, one with abuses and one without, and the higher of the two scores is used, to account for countries where arrests, murders, etc, of journalists are rare, but journalism is tightly controlled.
I’ve used WPFI data from 2002–2017. Due to various changes in the scoring system prior to 2013, I’ve scaled the scores within each year to provide some degree of comparison, and multiplied scores by -1, so higher scores indicate greater press freedom.
World Press Freedom Index plot
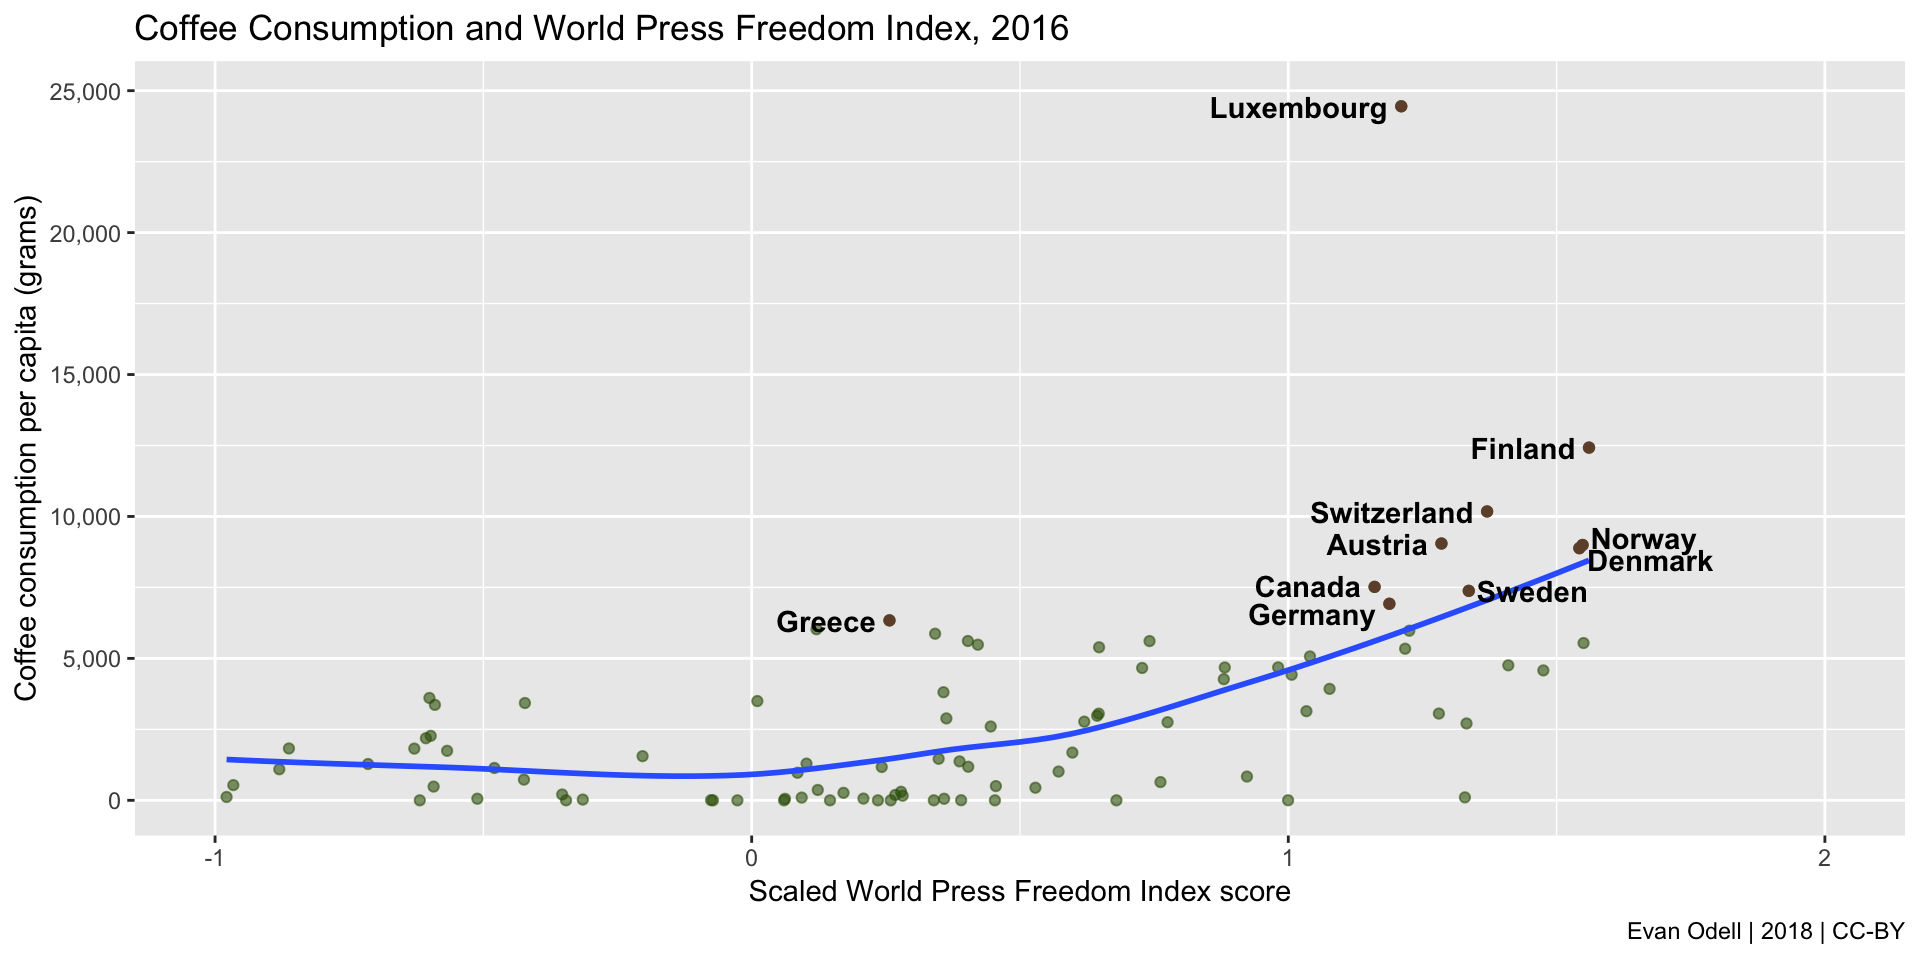
Five of the top ten coffee drinking countries are also in the top ten of press freedom in 2016, including Finland, which topped the press freedom index that year, its Nordic neighbours Sweden, Norway and Denmark, as well as Switzerland. Most surprising is Greece, who sits just below the median of scaled press scores (the median is greater than 0 because the WPFI covers more countries than I have coffee consumption data for, and the missing coffee countries have much lower press freedom than higher countries).
World Press Freedom Index panel analysis
## Twoways effects Within Model
##
## Call:
## plm(formula = scaled_consumption ~ scaled_press * ppp_capita_scaled,
##     data = press_comp2, effect = "twoway", model = "within",
##     index = c("country", "year"))
##
## Unbalanced Panel: n = 105, T = 7-14, N = 1400
##
## Residuals:
##       Min.    1st Qu.     Median    3rd Qu.       Max.
## -1.1407569 -0.0478411  0.0044739  0.0491473  0.8330897
##
## Coefficients:
##                                   Estimate  Std. Error t-value Pr(>|t|)
## scaled_press                   -0.00038454  0.01477842 -0.0260   0.9792
## ppp_capita_scaled              -0.05175230  0.04566128 -1.1334   0.2573
## scaled_press:ppp_capita_scaled  0.00149864  0.01874887  0.0799   0.9363
##
## Total Sum of Squares:    26.377
## Residual Sum of Squares: 26.351
## R-Squared:      0.0010051
## Adj. R-Squared: -0.092724
## F-statistic: 0.428919 on 3 and 1279 DF, p-value: 0.73231
There does not appear to be any significant relationship between coffee consumption and press freedom when controlling for a country’s purchasing power parity per capita in a fixed effects model. I was surprised by this result, but it may partially stem from the WPFI’s methodology that includes measures of media diversity and corruption, which lowers the score of countries like Greece.
Freedom in the World
The Freedom in the World (FIW) index is published annually by Freedom House, an American NGO largelly supported by the US government. It uses a ranking of 1–7, with 1 being the most free and 7 being the least. For consistency and ease of comparison, I have reversed this, so that 1 is the least free and 7 is the most free. I have included FIW data from 1990–2017.
Freedom in the World plot
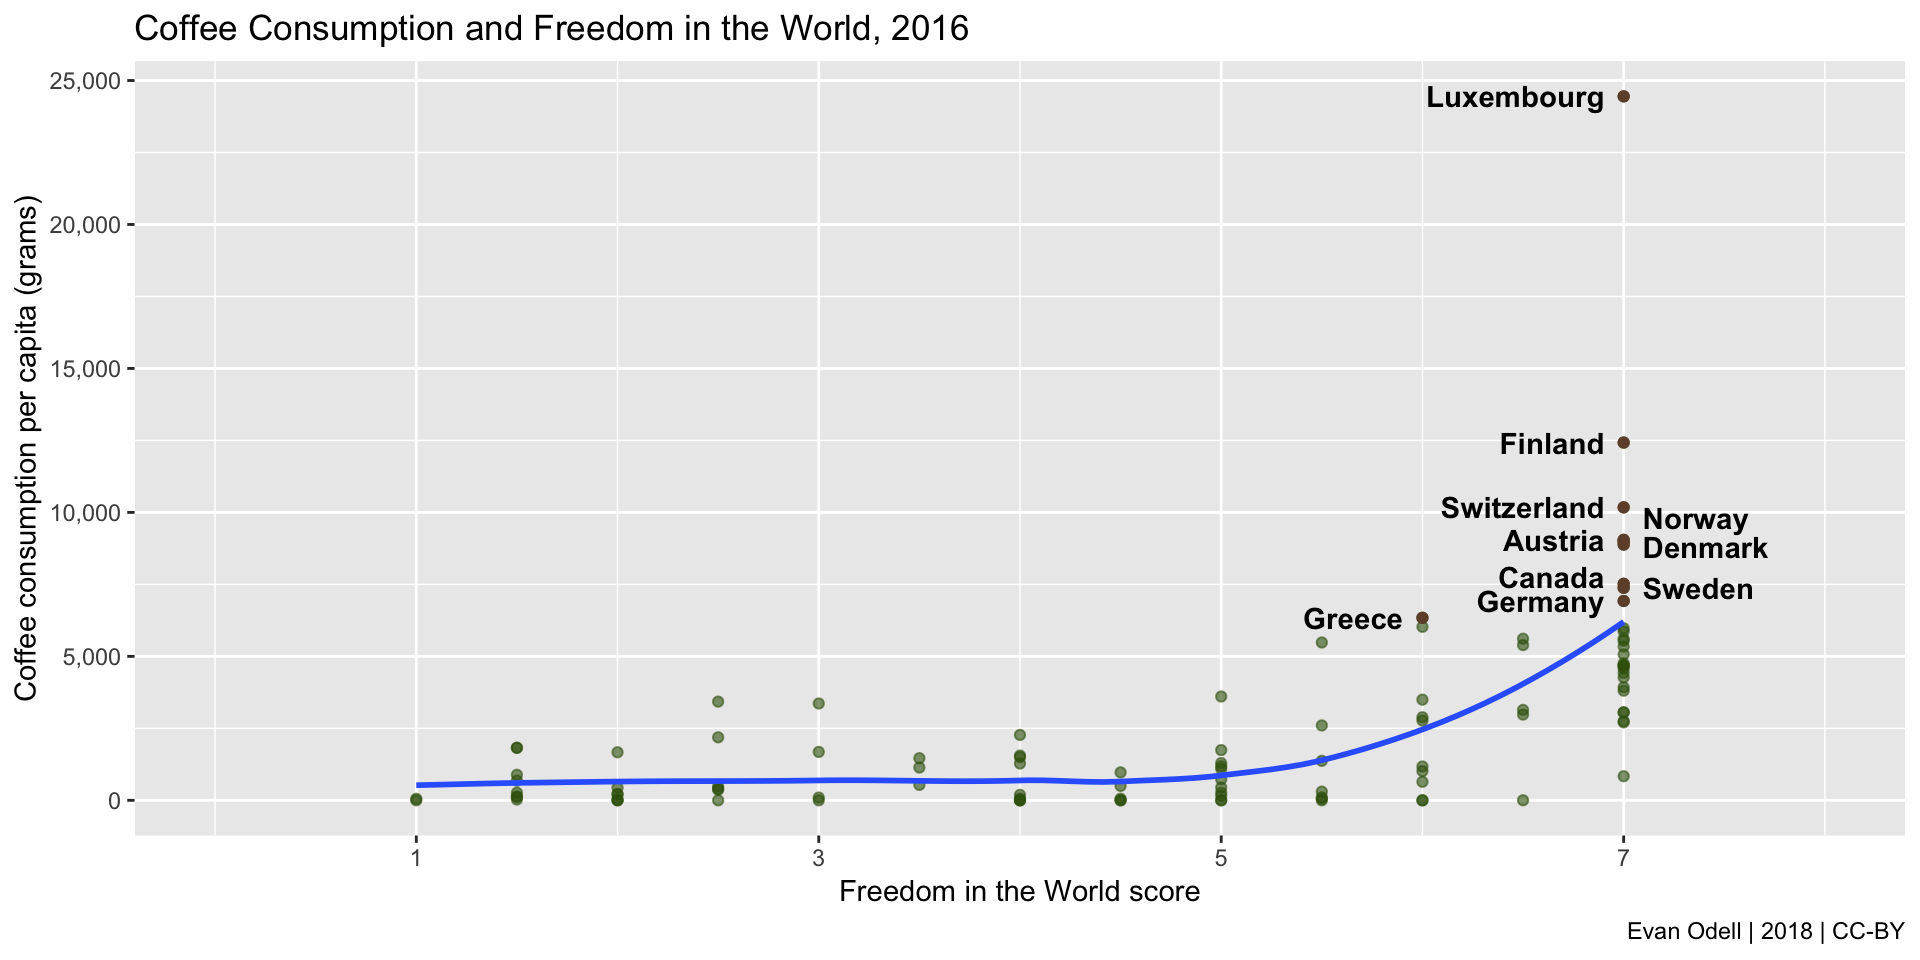
All-but-one of the world’s top coffee drinking countries had the highest possible scores in 2016. In fact, with the exceptions of Greece and Germany (who have had the highest possible score every year from 2002 onwards), the top ten coffee drinking countries have enjoyed the highest scores in the FIW every year since at least 1990. With the FIW, it appears that a handful of high-scoring countries drink a lot of coffee, while other high scoring countries drink comparatively little.
Freedom in the World panel analysis
## Twoways effects Within Model
##
## Call:
## plm(formula = scaled_consumption ~ scaled_fiw * ppp_capita_scaled,
##     data = fiw_comp2, effect = "twoway", model = "within", index = c("country",
##         "year"))
##
## Unbalanced Panel: n = 105, T = 9-27, N = 2486
##
## Residuals:
##         Min.      1st Qu.       Median      3rd Qu.         Max.
## -3.101829590 -0.069984905 -0.000045465  0.063993267  2.090463120
##
## Coefficients:
##                              Estimate Std. Error t-value    Pr(>|t|)
## scaled_fiw                   0.071525   0.022348  3.2006     0.00139 **
## ppp_capita_scaled            0.197932   0.044608  4.4371 0.000009536 ***
## scaled_fiw:ppp_capita_scaled 0.109048   0.026666  4.0894 0.000044696 ***
## ---
## Signif. codes:  0 '***' 0.001 '**' 0.01 '*' 0.05 '.' 0.1 ' ' 1
##
## Total Sum of Squares:    179.83
## Residual Sum of Squares: 177.29
## R-Squared:      0.014128
## Adj. R-Squared: -0.041621
## F-statistic: 11.2352 on 3 and 2352 DF, p-value: 0.00000025588
The two-ways fixed effects model shows that there is a a positive relationship between higher FIW scores and coffee consumption, after controlling for purchasing power parity per capita.
Polity IV
Polity IV plot
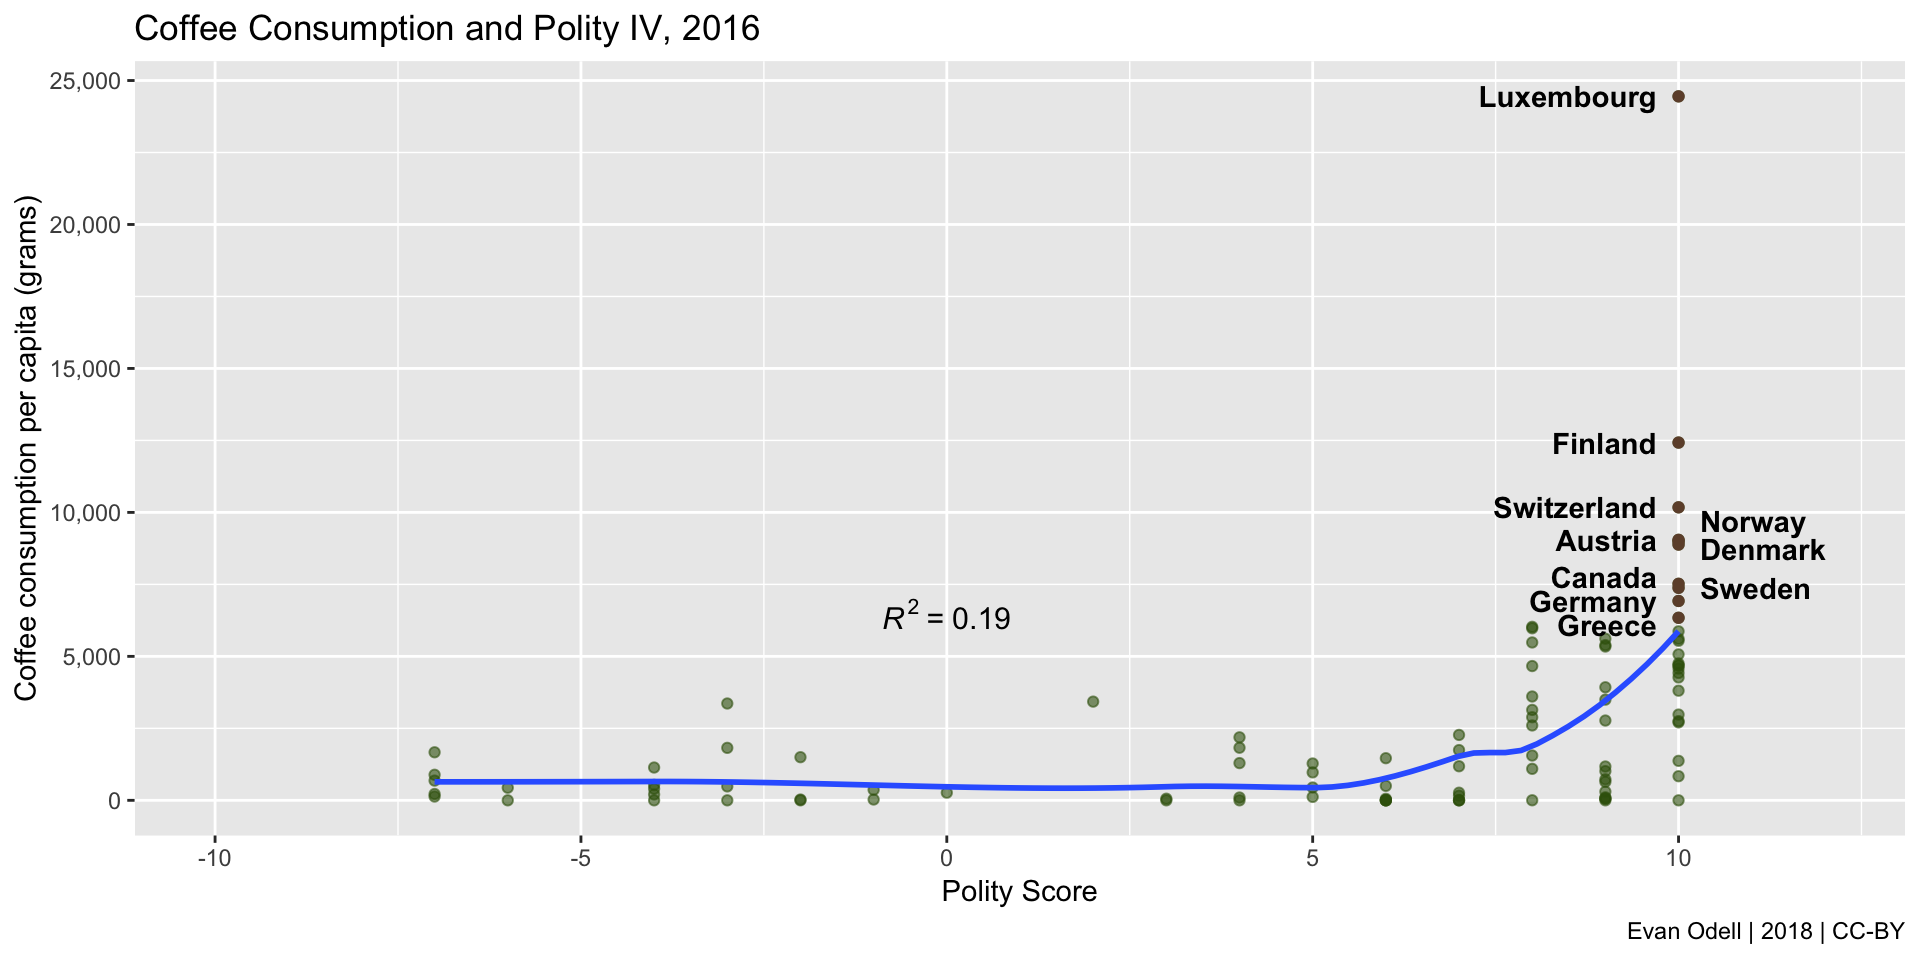
Polity IV panel analysis
## Twoways effects Within Model
##
## Call:
## plm(formula = scaled_consumption ~ scaled_polity2 * ppp_capita_scaled,
##     data = polity_iv2, effect = "twoway", model = "within", index = c("scode",
##         "year"))
##
## Unbalanced Panel: n = 104, T = 4-27, N = 2434
##
## Residuals:
##        Min.     1st Qu.      Median     3rd Qu.        Max.
## -3.07658363 -0.06835684  0.00056557  0.06198151  2.07016697
##
## Coefficients:
##                                  Estimate Std. Error t-value     Pr(>|t|)
## scaled_polity2                   0.080544   0.019271  4.1796 0.0000302985
## ppp_capita_scaled                0.236021   0.045816  5.1515 0.0000002803
## scaled_polity2:ppp_capita_scaled 0.132177   0.026295  5.0267 0.0000005376
##
## scaled_polity2                   ***
## ppp_capita_scaled                ***
## scaled_polity2:ppp_capita_scaled ***
## ---
## Signif. codes:  0 '***' 0.001 '**' 0.01 '*' 0.05 '.' 0.1 ' ' 1
##
## Total Sum of Squares:    174.21
## Residual Sum of Squares: 171.01
## R-Squared:      0.018347
## Adj. R-Squared: -0.037967
## F-statistic: 14.3348 on 3 and 2301 DF, p-value: 0.000000002968
The Polity IV panel analysis includes data from 1960 (but only for the United States) to 2016. There is a positive relationship between coffee consumption and Polity IV score.
Conclusion
By some measures, there is a positive relationship between coffee consumption and freedom, although it does not appear to be as important as other factors, including the wealth of that society. Of the indices used, only the World Press Freedom Index and Polity IV did not show a statistically significant positive relationship between coffee consumption and their definition of freedom.
The relationship between coffee consumption and wealth is much clearer. Coffee is a luxury item, and it is little surprise that the world’s largest consumer of coffee per capita – Luxembourg – is also one of the worlds richest states per capita.
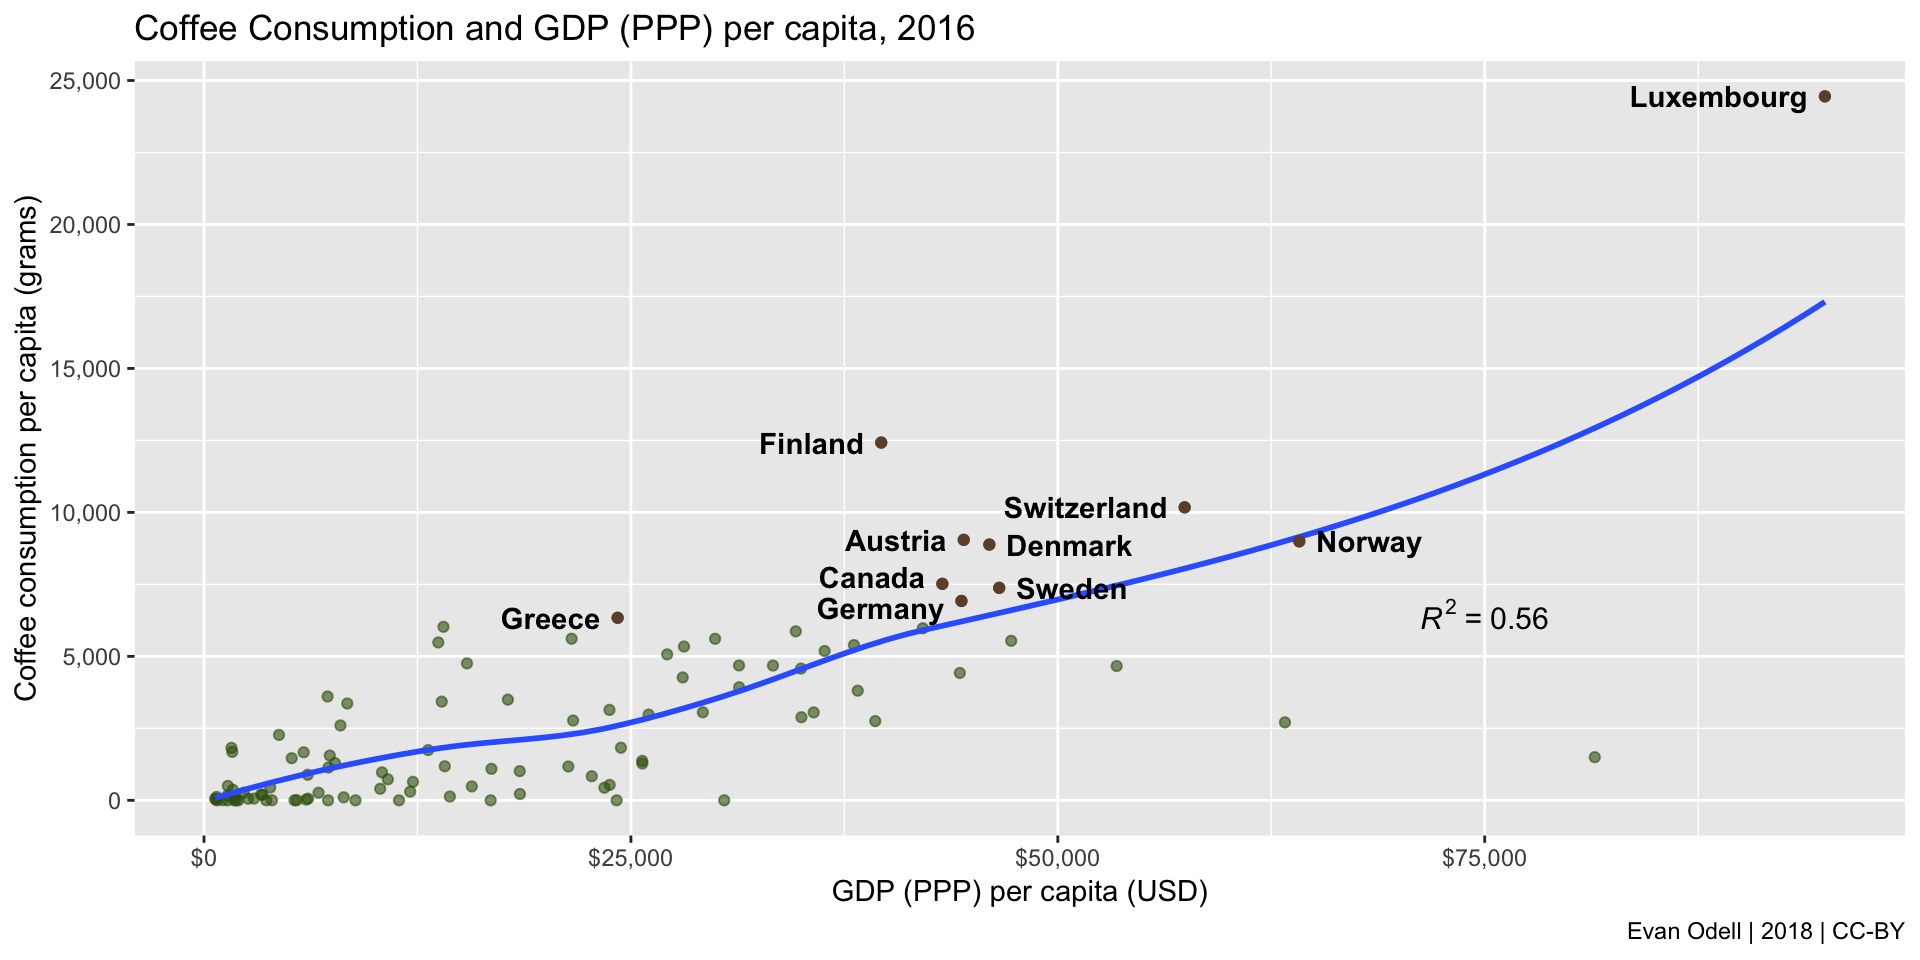
Ultimate I think the positive relationships I’ve identified between coffee consumption and some measures of freedom are largely spurious. The relationship between wealth and coffee consumption is much clearer than any measure of freedom and coffee consumption.
Notes
The code used in this blog is available on GitHub using a MIT license.
References
Economist Intelligence Unit. 2017. “Democracy Index 2017: Free Speech Under Attack.” London: Economist Intelligence Unit. http://pages.eiu.com/rs/753-RIQ-438/images/Democracy_Index_2017.pdf.
Freedom House. 2018. “Freedom in the World 2018: Democracy in Crisis.” Washington, DC: Freedom House. https://freedomhouse.org/report/freedom-world/freedom-world-2018.
Kohl, Andreas, and Juan Pina. 2016. “World Index of Moral Freedom 2016.” Madrid: Foundation for the Advancement of Liberty. http://www.fundalib.org/wp-content/uploads/2016/04/World-Index-of-Moral-Freedom-web.pdf.
Marshall, Monty G, Ted Robert Gurr, and Keith Jaggers. 2017. “Polity IV Annual Time-Series, 1800-2016.” Vienna, Virginia: Center for Systemic Peace.
Reporters without Borders. 2017. “2017 World Press Freedom Index.” Paris: Reporters without Borders. https://rsf.org/en/world-press-freedom-index.