My newest R data retrieval package guardianapi to arrive on CRAN contains functions to search and retrieve articles, tags and editions from the Guardian open data platform. I wrote this package because I was wondering why the Guardian comedy critic Brian Logan never seemed to give five or one star reviews, and if this was actually the case or just the reviews of his I happened to read. I got every review from the start of 2014 to the end of 2018, across all sections,
and selected the following sections for analysis: “Art and design”, “Film”, “Games”, “Music”, “Stage”, “Technology”, “Television & radio”.
library(guardianapi)
library(dplyr)
library(lubridate)
library(ggplot2)

critic_search <- gu_items("tone/reviews",
                          from_date = "2014-01-01", to_date = "2018-12-31",
                          lang = "en"
 )

#readr::write_rds(critic_search, "critic_search.rds")

critic_search$star_rating <- as.numeric(critic_search$star_rating)

critic_search$year <- factor(year(critic_search$web_publication_date))


critic_search <- critic_search %>%
  filter(!is.na(star_rating), star_rating != 0, !is.na(byline), byline != "",
         section_name %in% c("Art and design", "Film", "Games", "Music",
                             "Stage", "Technology", "Television & radio"))

critic_summary_section <- critic_search %>%
  group_by(section_name, star_rating) %>%
  summarise(count = n()) %>%
  mutate(perc = count/sum(count)) %>%
  ungroup()

star_distro <- critic_search %>%
  group_by(star_rating) %>%
  summarise(count = n()) %>%
  mutate(perc = count/sum(count))

#created this for inline text purposes
star1 <- critic_summary_section %>% filter(star_rating == 1)

comp_p <- ggplot(critic_summary_section) +
  geom_line(data = star_distro, aes(x = star_rating, y = perc),
            size = 1.5, colour = "green", alpha = 0.5) +
  scale_y_continuous(labels = scales::percent,
                     breaks = seq(from = 0.1, to = 0.5, by = 0.1)) +
  geom_line(aes(x = star_rating, y = perc, linetype = section_name,
                colour = section_name, group = section_name),
            size = 1) +
  scale_colour_viridis_d(end = 0.9, option = "inferno")  +
  labs(x = "Star Rating", y = "", fill = "", colour = "",
       caption = "© Evan Odell | 2019 | CC-BY-SA") +
  theme(legend.position = "bottom") +
  scale_linetype_manual("", values = c(1:7))

comp_p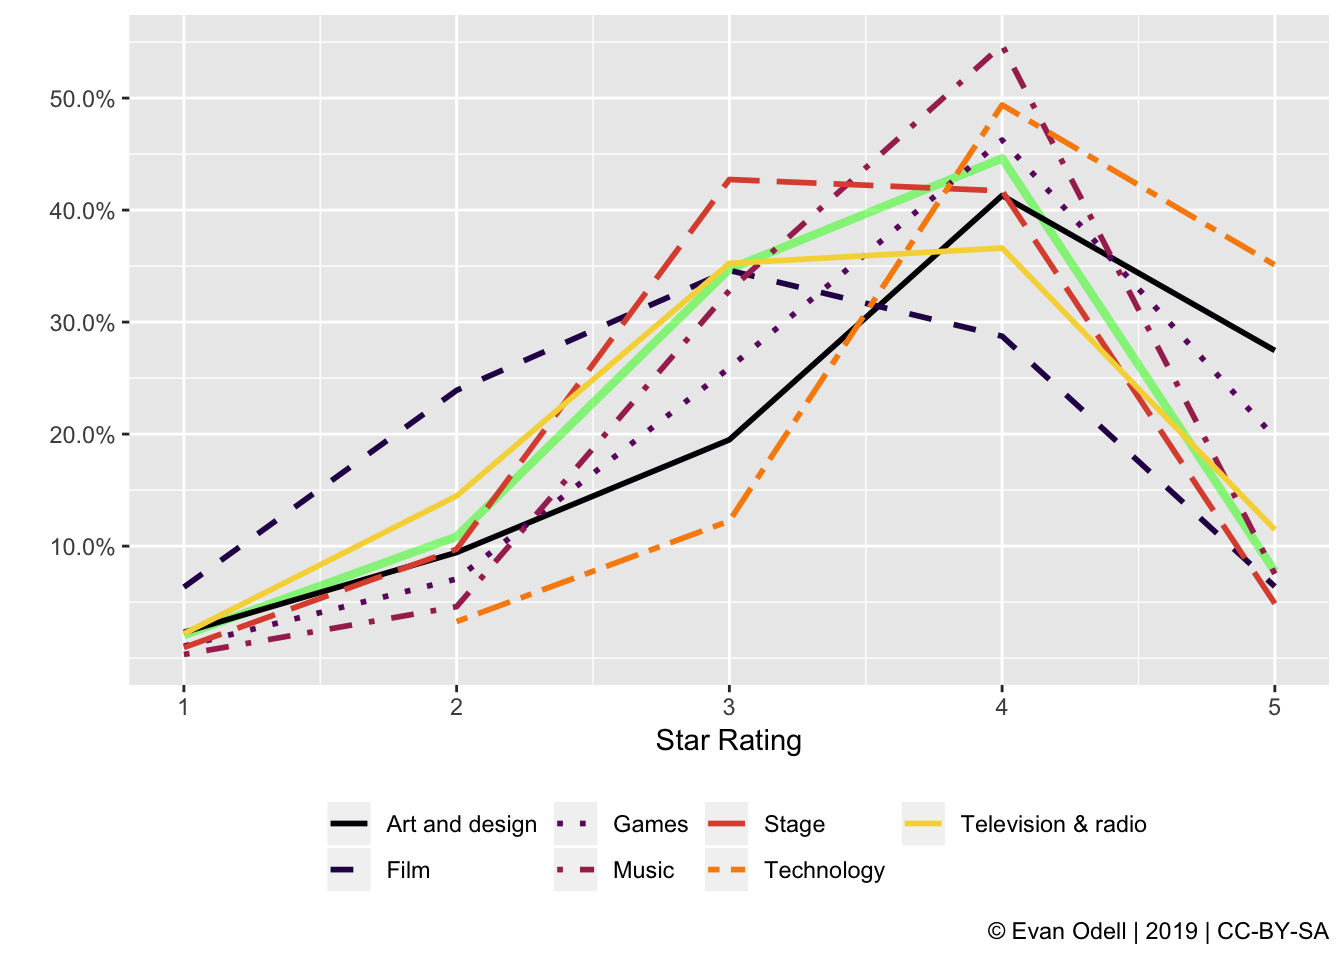
Over a third of technology reviews (35.1%) were five stars. Film critics also seemed much more likely to write very negative reviews, with one star reviews making up 6.34% of all film reviews, compared to just 2.31% of Art and design, the category with the next highest percentage of one star reviews.
The remove_vector contains extra information sometimes included in writer bylines, which I removed.
library(stringi)
remove_vector <- c(", Observer film Critic", ", Observer film criic",
                   " in Detroit", "\r\n", " in Austin", " in New Orleans",
                   ",Observer film critic", " in Venice", " in New York",
                   " in Chicago", " in Park City, Utah", " in Berlin",
                   "in Las Vegas", ", Obsverver film critic", "in Cannes",
                   ", Observer fim critic", " in Toronto", " in Los Angeles",
                   " in Indio, California", " Observer film critic",
                   ", from the international documentary film festival, Amsterdam",
                   " at the International Documentary film festival Amsterdam",
                   " in Millburn, New Jersey", " in Hobart",
                   " Guardian film critic", " North of England editor",
                   ", Observer filim critic", "Mark Kermode,")

critic_search$byline <- stri_replace_all_fixed(critic_search$byline,
                                               remove_vector,
                                               c(""), vectorize_all = FALSE)

critic_search$byline <- if_else(critic_search$byline == "Peter",
                                "Peter Bradshaw", critic_search$byline)

critic_sum_byline <- critic_search %>%
  filter(!is.na(star_rating), star_rating != 0, !is.na(byline), byline != "",
         section_name %in% c("Art and design", "Film", "Games", "Music",
                             "Stage", "Technology", "Television & radio")) %>%
  group_by(byline) %>%
  mutate(n = n(),
         var = var(star_rating)) %>%
  filter(n >= 100) %>%
  ungroup() %>%
  mutate(byline = trimws(byline),
         byline = stri_replace_all_fixed(byline, "  ", " ")) %>%
  group_by(var, byline, star_rating) %>%
  summarise(count = n()) %>%
  mutate(perc = count/sum(count)) %>%
  ungroup()

critic_star_means <- critic_search %>%
  group_by(byline) %>%
  summarise(mean = mean(star_rating),
            count = n()) %>%
  filter(count >= 100)

select_highlights <- bind_rows(
  top_n(distinct(critic_sum_byline, byline, var), n = 3, wt = var),
  top_n(distinct(critic_sum_byline, byline, var), n = -3, wt = var),
  top_n(critic_star_means, n = 3, wt=mean),
  top_n(critic_star_means, n = -3, wt=mean)
) %>% select(byline) %>% distinct()

critic_sum_byline$highlights <- critic_sum_byline$byline %in% select_highlights$byline

comp_p2 <- ggplot() +
  scale_y_continuous(labels = scales::percent) +
  labs(x = "Star Rating", y = "", fill = "") +
  theme(legend.position = "bottom") +
  geom_line(data = star_distro, aes(x = star_rating, y = perc),
            size = 1.5, colour = "green", alpha = 0.5) +
  geom_line(data = critic_sum_byline %>% filter(!highlights),
            aes(x = star_rating, y = perc,
                group = byline), alpha = 0.2,
            size = 1) +
  geom_line(data = critic_sum_byline %>% filter(highlights),
            aes(x = star_rating, y = perc, linetype = byline,
                colour = byline, group = byline),
            size = 1) +
  scale_colour_manual(values = c(viridis::magma(nrow(select_highlights),
                                                end = 0.8))) +
  scale_linetype_manual("", values = c(1:nrow(select_highlights))) +
  labs(colour = "", caption = "© Evan Odell | 2019 | CC-BY-SA")

comp_p2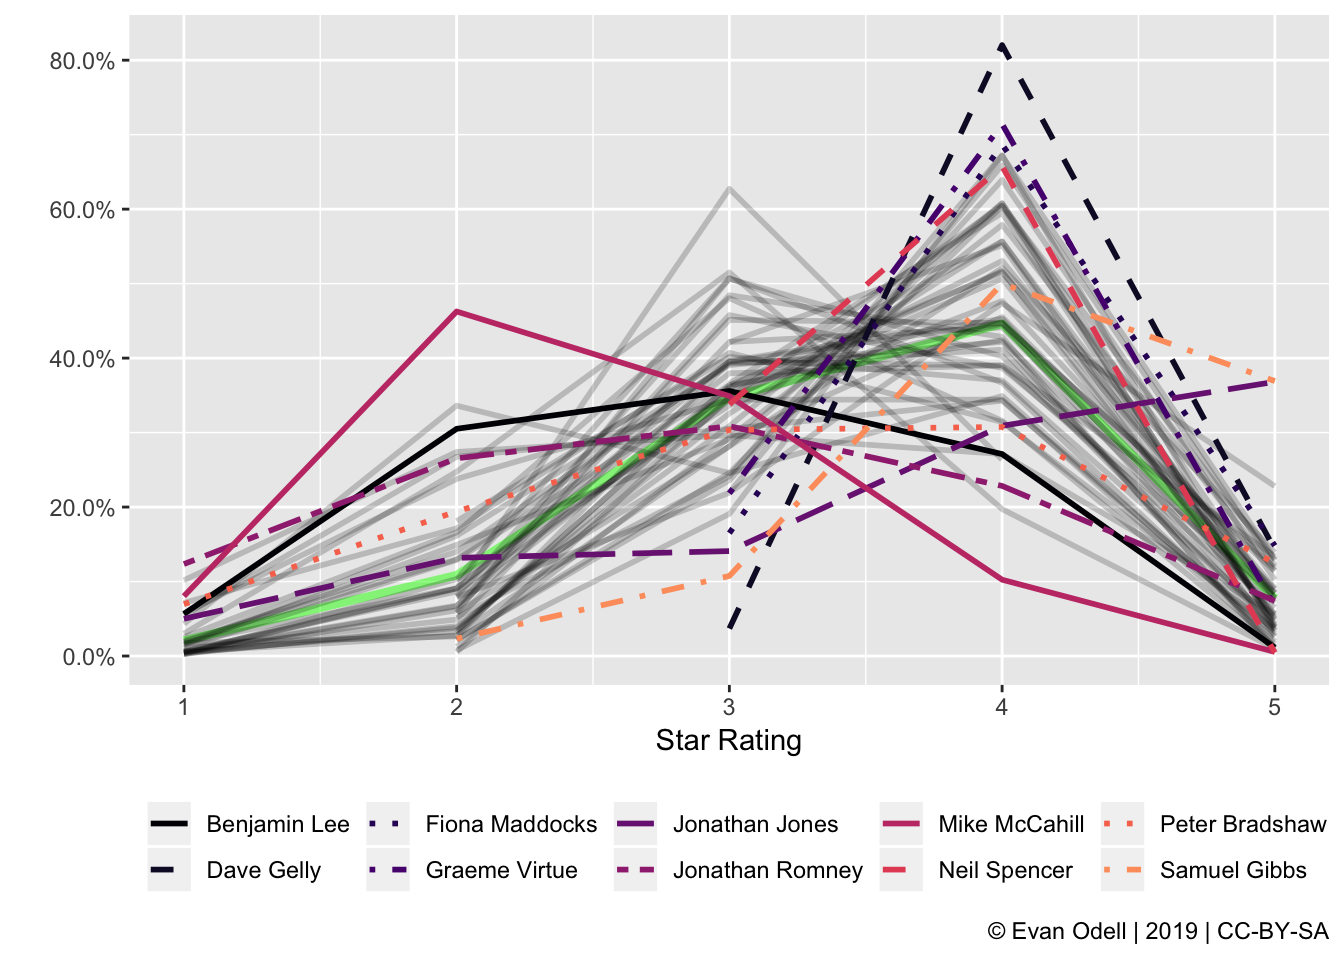
The big green line represents the distribution of all reviews published by the Guardian from 2014–2018, with the grey lines showing the individual distribution of star ratings from all critics with 100 or more reviews. The highlighted critics are the three critics with the highest and lowest variance, and the highest and lowest average star ratings. Two critics (Dave Gelly and Jonathan Romney) were in more than one category, for a total of 10 highlighted critics. Jazz critic Dave Gelly and TV critic Graeme Virtue are unusual in how often they use four star reviews, with Dave Gelly giving out four stars in 82.0% of all his reviews. Mike McCahill, on the other hand, seems to review the films no one else wants to see. His average star rating is 2.49, well below the next lowest of average of 2.86 from Jonathan Romney.
For more information on the guardianapi package, see the docs, and download it from CRAN or GitHub.