Earlier this week the DWP secretary Amber Rudd announced a series of changes to the disability benefits system, including scrapping re-assessment for pensioners and possibly combining the assessment for the two main working-age disability benefits: Employment and Support Allowance (ESA), a means-tested benefit providing financial support to unemployed disabled people, and Personal Independence Payment (PIP), a needs-tested benefit to help with the additional cost of living associated with disability.
The reaction from the disability sector was at best lukewarm, with a variety of experts (including two of my collegues) concerned that the government simply doesn’t understand the problems with the benefits system it has created and are mostly tinkering around the edges rather than addressing fundamental issues.
One of the possible reforms is to combined PIP and ESA assessments, which use different criteria for eligibility as they serve fundamentally different purposes. The ESA assessment (the Work Capability Assessment, or WCA) has many problems, but the intention is to assess a person’s ability to engage in paid work. PIP is supposed to assess the additional financial cost of having a disability or health condition. ESA eligibility is also determined in part by household income and savings, while PIP does not. However, many disabled people receive both.
The DWP StatXplore tool has benefit combinations, including the ability to compare claimants receiving PIP and Disability Living Allowance (DLA, PIP’s predecessor that roughly 1.8 million people still get) to ESA and its precessor Incapacity Benefit (this combination is labelled INCAP by the DWP). Of course, off the back of Amber Rudd’s speech some disabled people and activists were wondering how many many people claimed both ESA and PIP.
Does anyone know where I can find figures on ESA/DLA receipt overlap (what proportion of people in receipt of ESA also receive DLA/PIP, and vice versa)? I'm sure I've seen them somewhere but can't remember where. @Hossylass @octoberpoppy @theyoungjane @djmgaffneyw4 @simonjduffy
— Stef Benstead (@StefBenstead) March 7, 2019
So in response to the above tweet I created a graph (Figure 1.) to show the rate of overlap between the two benefits and how it had changed from February 2013 to August 2018.
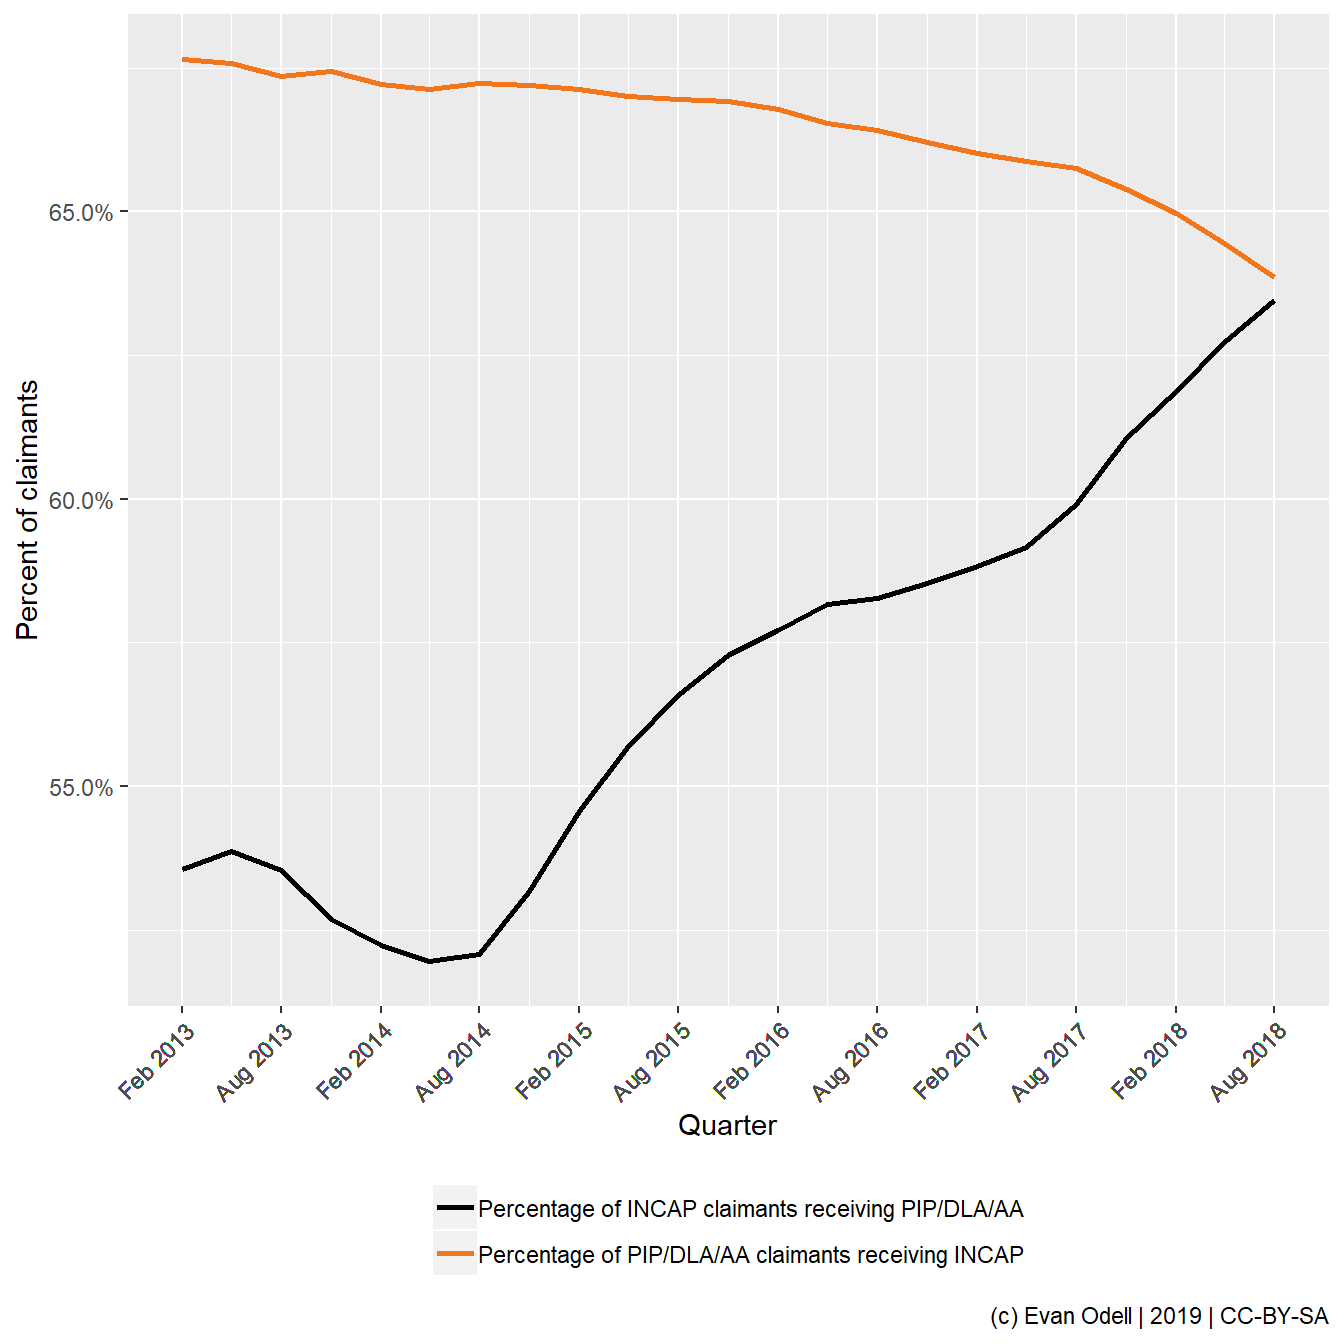
Figure 1: Percentage of one group of benefit recipients receiving the other type of benefit
This prompted discussion about why there appeared to be convergence, and changes in state pension age were mooted as one possible explanation. So here is Figure 2, with five year age bands from 18-64.
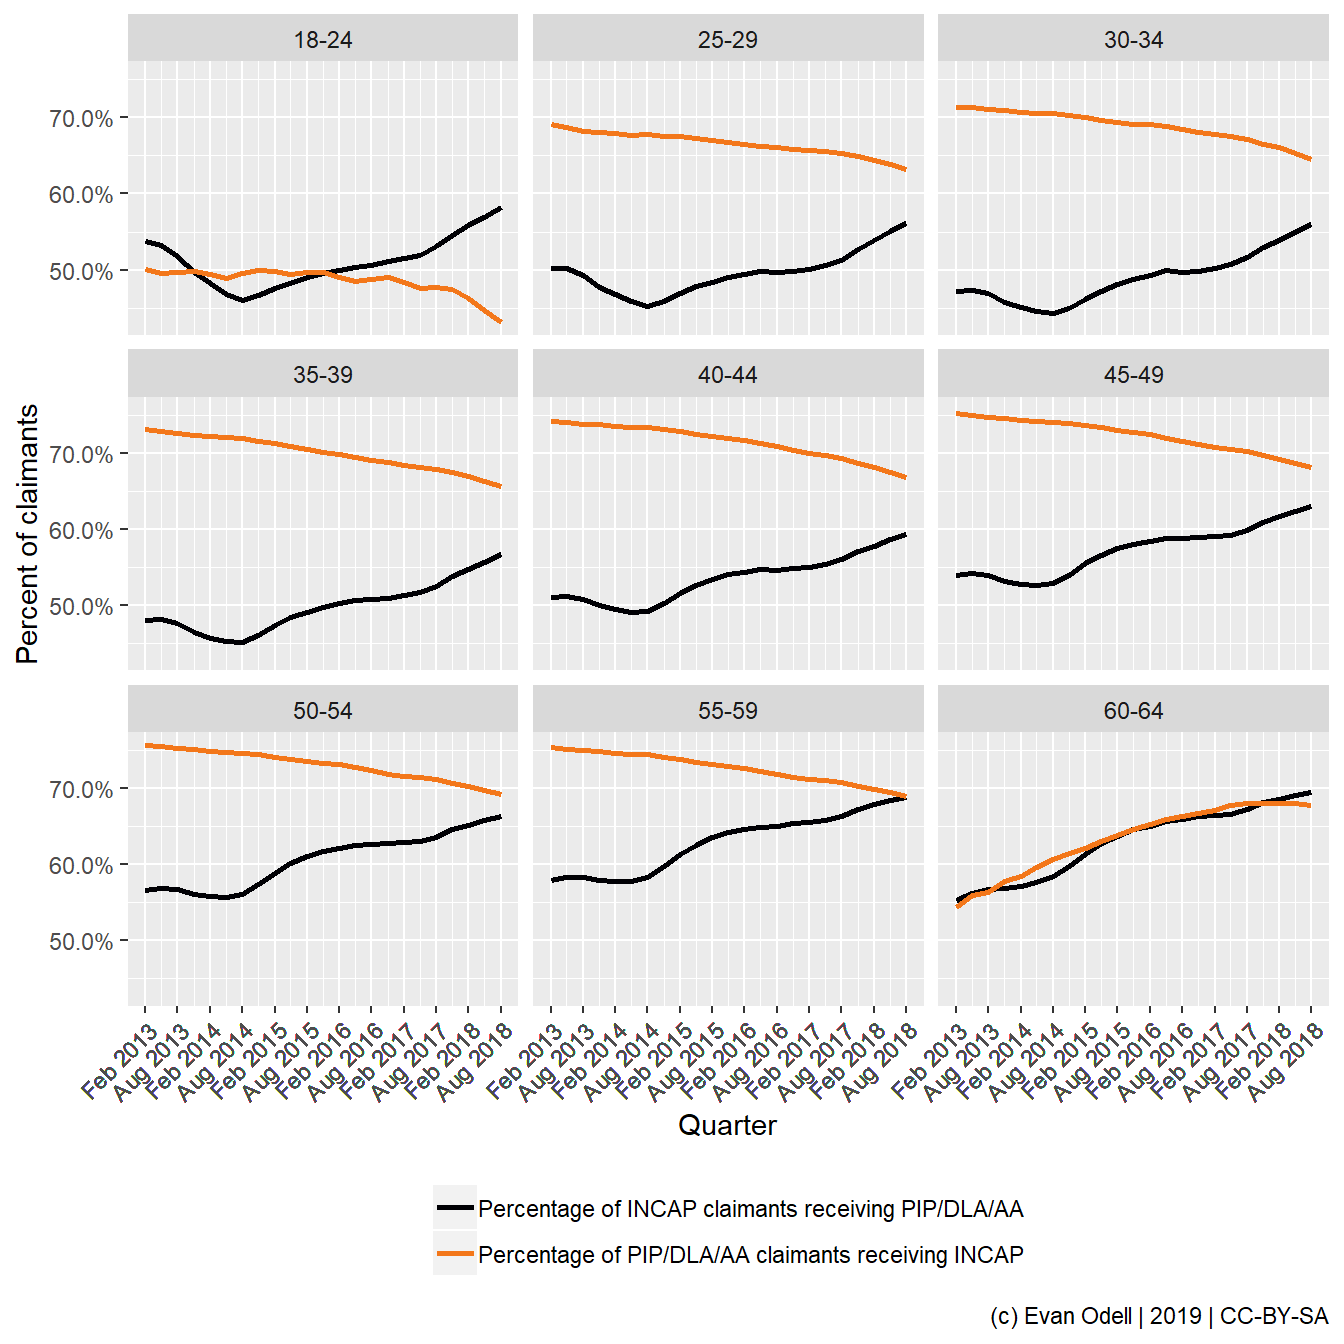
Figure 2: Percentage of one group of benefit recipients receiving the other type of benefit with five year age bands
I was also curious to see the absolute numbers of people claiming PIP/DLA/AA and/or INCAP, so created Figures 3 and 4 to take a look.
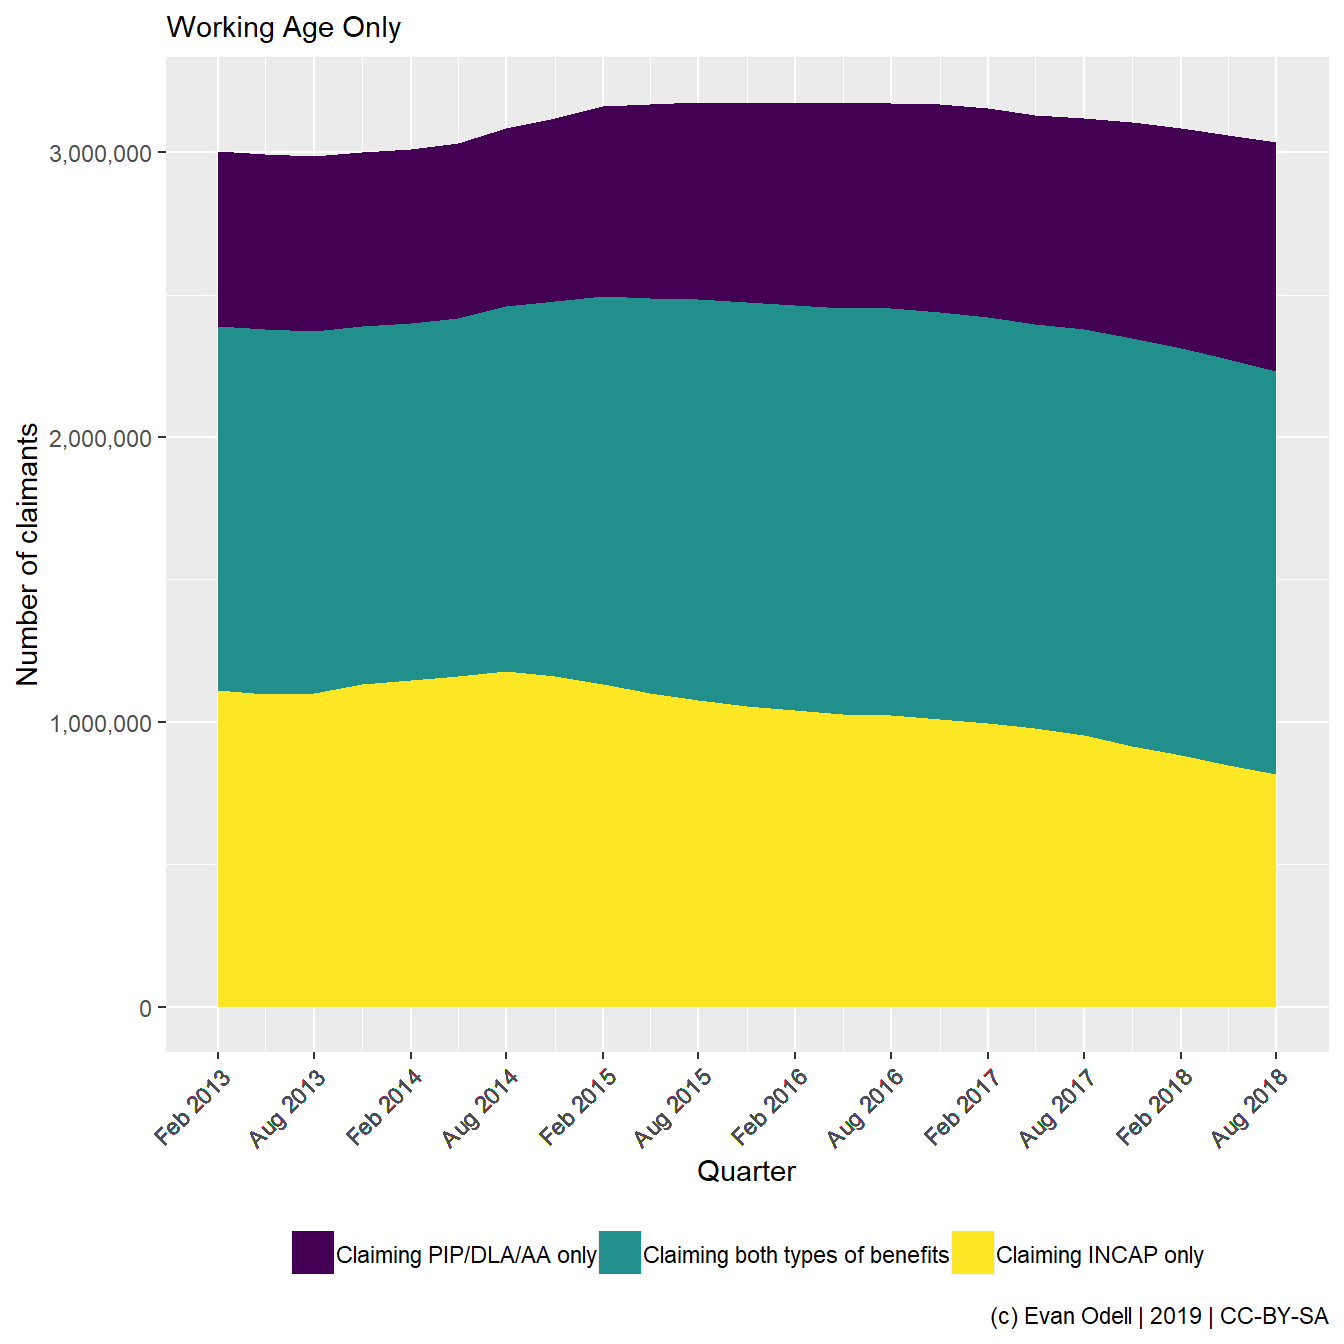
Figure 3: Total of one group of benefit recipients receiving the other type of benefit
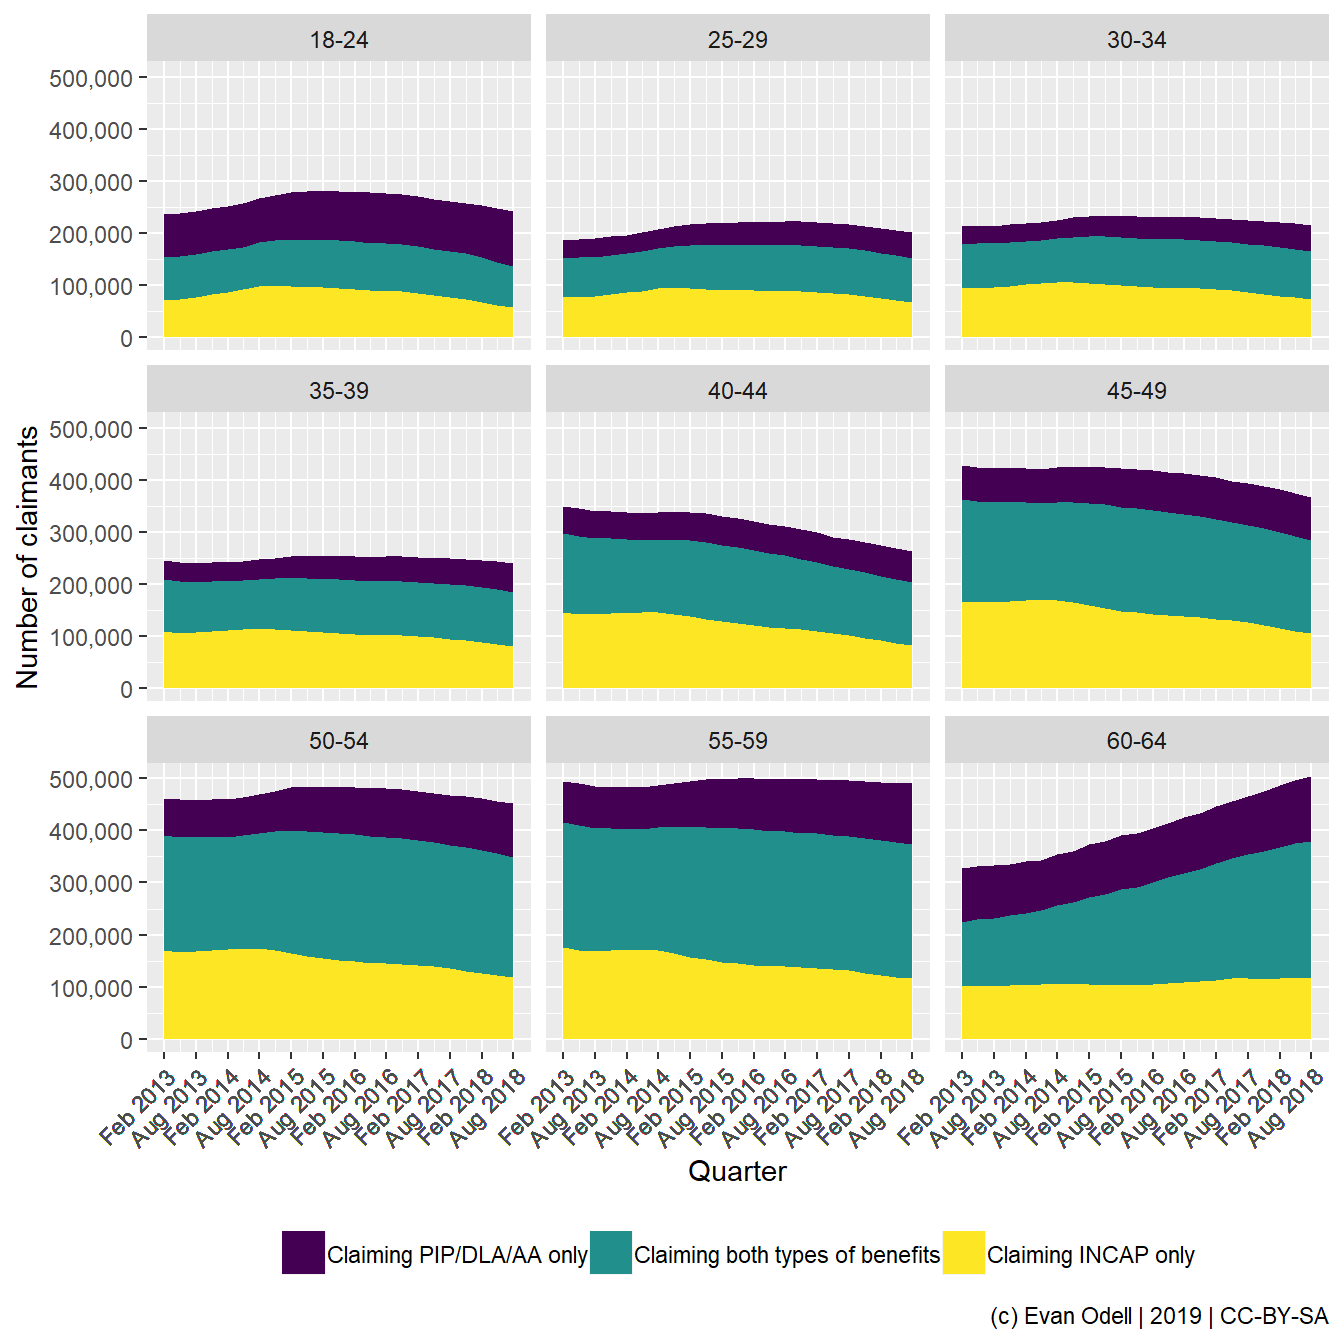
Figure 4: Total of one group of benefit recipients receiving the other type of benefit with five year age bands