How much money can you save cycling instead of using public transport? This blog shows what I spent and what I saved while using cycling as my primary form of transport for 1,516 days, or just shy of 4 years and 2 months. This covers from when I first bought a bike on 30 June 2016 to 23 August 2020, the day before I packed my bike away as part of my move to Berlin. I previously discussed this balance about 8 months into my time cycling, at which point I had spent almost £20 more on my bike and my pay-as-you-go Oyster card compared to a monthly Oyster pass.
Over the time period covered here, I bought a fancy new bike (I wanted the stopping power of disc brakes), sold my first bike, had my new bike stolen and managed to find an identical replacement new on ebay, which my insurance thankfully (mostly) paid for.
I include all spending directly on my bike: the bike itself, accessories, spare parts, insurance, my storage locker, tools and maintenance. I also include non-bike costs that are the result of cycling, primarily clothing,1 but also London Cycling Campaign membership. Travel outside zones 1 and 2 are included in both the pay-as-you-go cost and added on to my travelcard cost, as I would be paying them regardless, assuming I only ever bought a zone 1-2 travelcard.
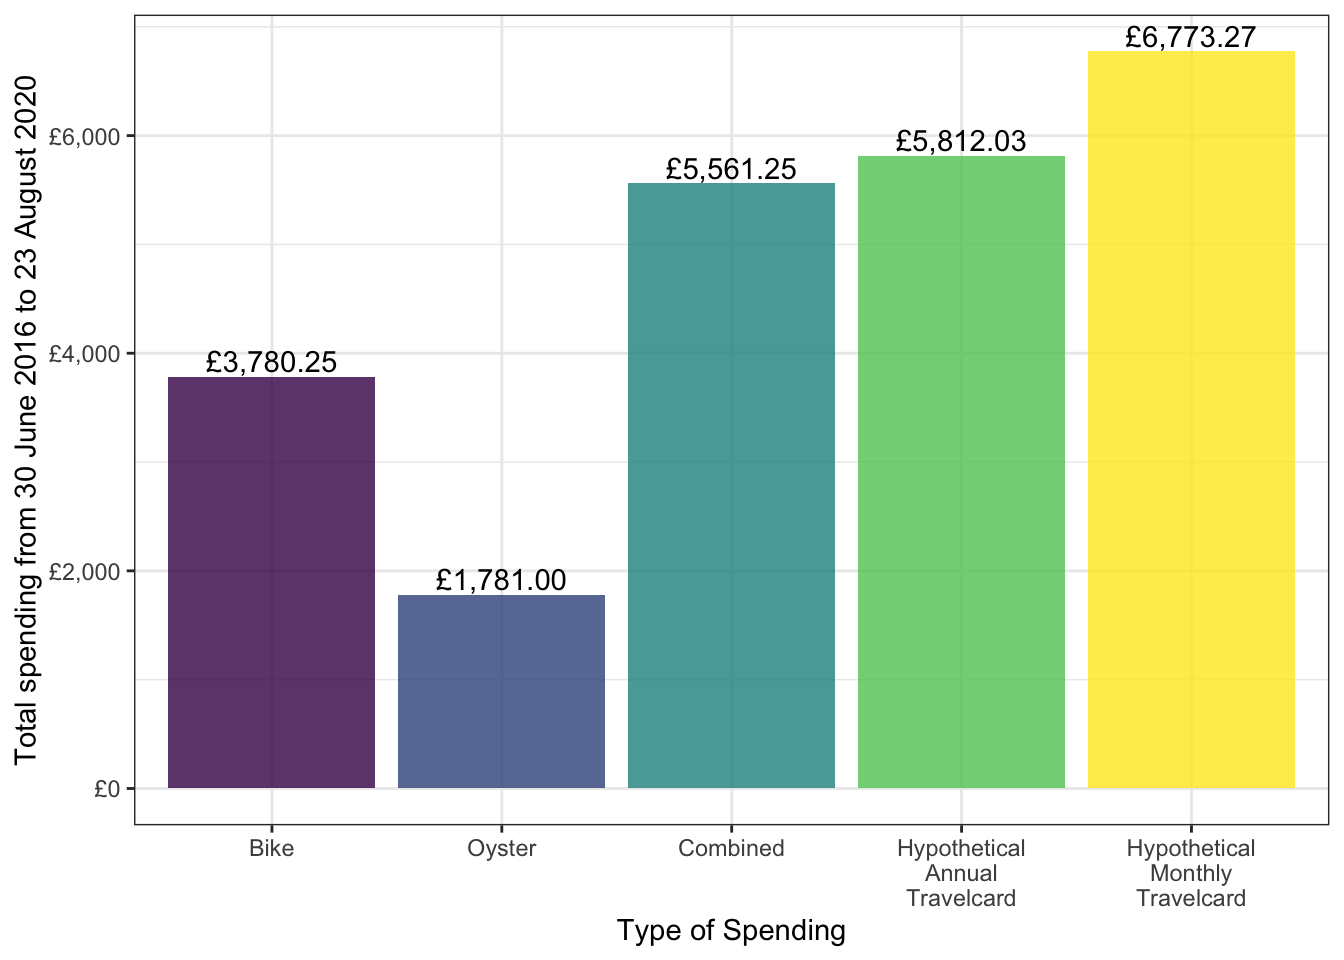
The purple and blue bars in Figure 1 are total spending on my bike and related accessories and my pay-as-you-go Oyster spending, respectively. The middle bar is the combined total of bicycle and pay-as-you-go spending, and the two bars on the right are the hypothetical total spending on an annual or monthly Travelcard, combined with all travel outside zones 1 and 2.
Figure 1: Total and combined spending
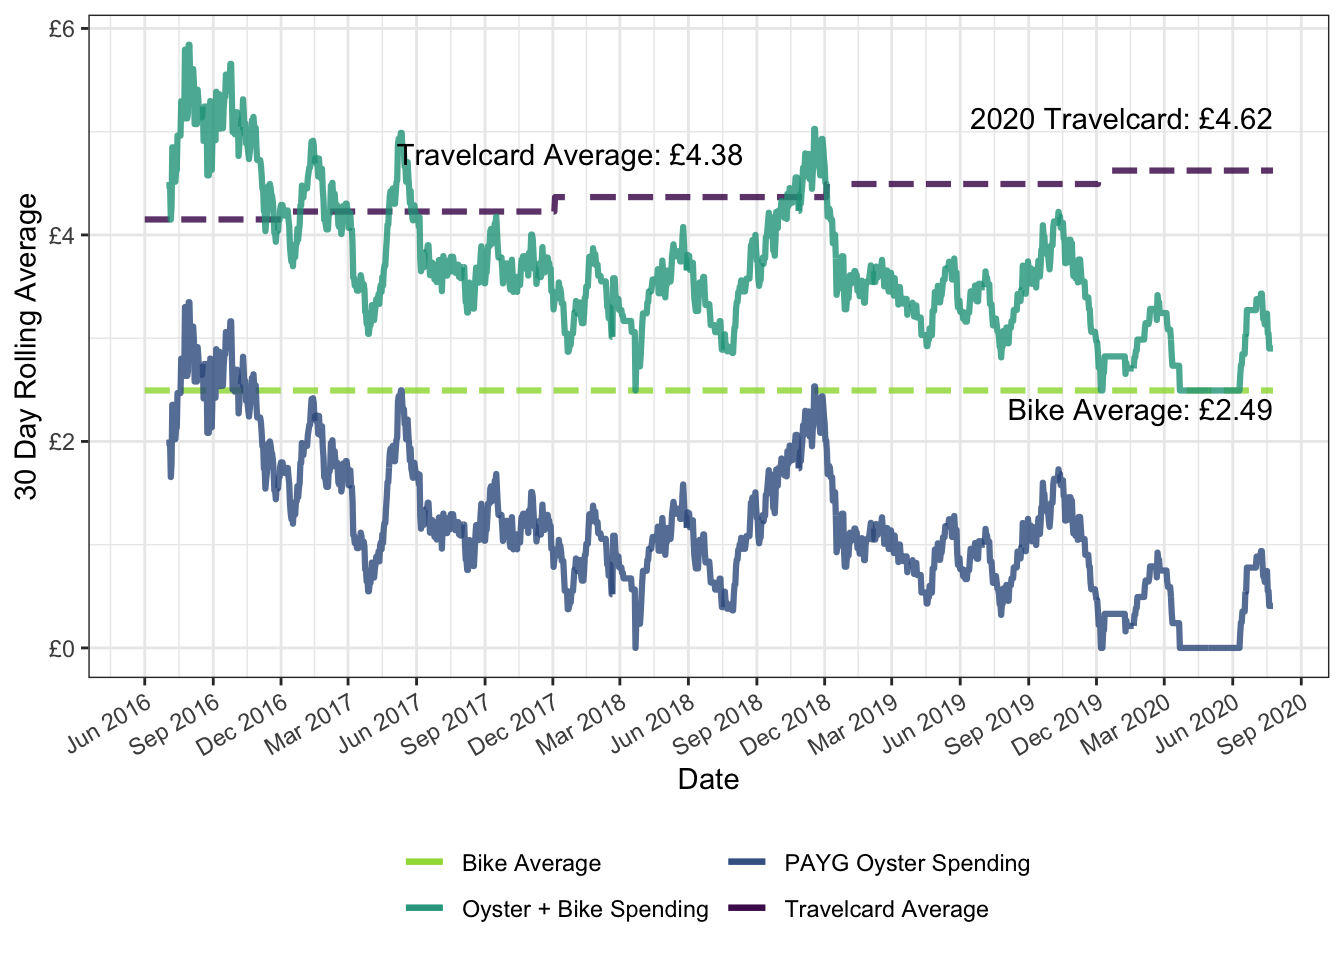
You can see in the two series plots below that since writing the blog post in February 2017 my Oyster spending has dropped off somewhat. Figure 2 shows a time series of pay-as-you-go Oyster and bike spending compared to a hypothetical annual pass, while Figure 3 compares the same to a monthly pass.
The dark purple dashed horizontal line represents the cost-per-day of a zone 1-2 Travelcard in London over this time period. The green dashed horizontal line represents the average daily cost of my bicycle and accessories. The blue line is a rolling average of pay-as-you-go Oyster spending over the previous month, and the light green line is pay-as-you-go Oyster spending combined with average daily bike costs.
Figure 2: Time series of spending on pay-as-you-go Oyster and cycling, annual travel card
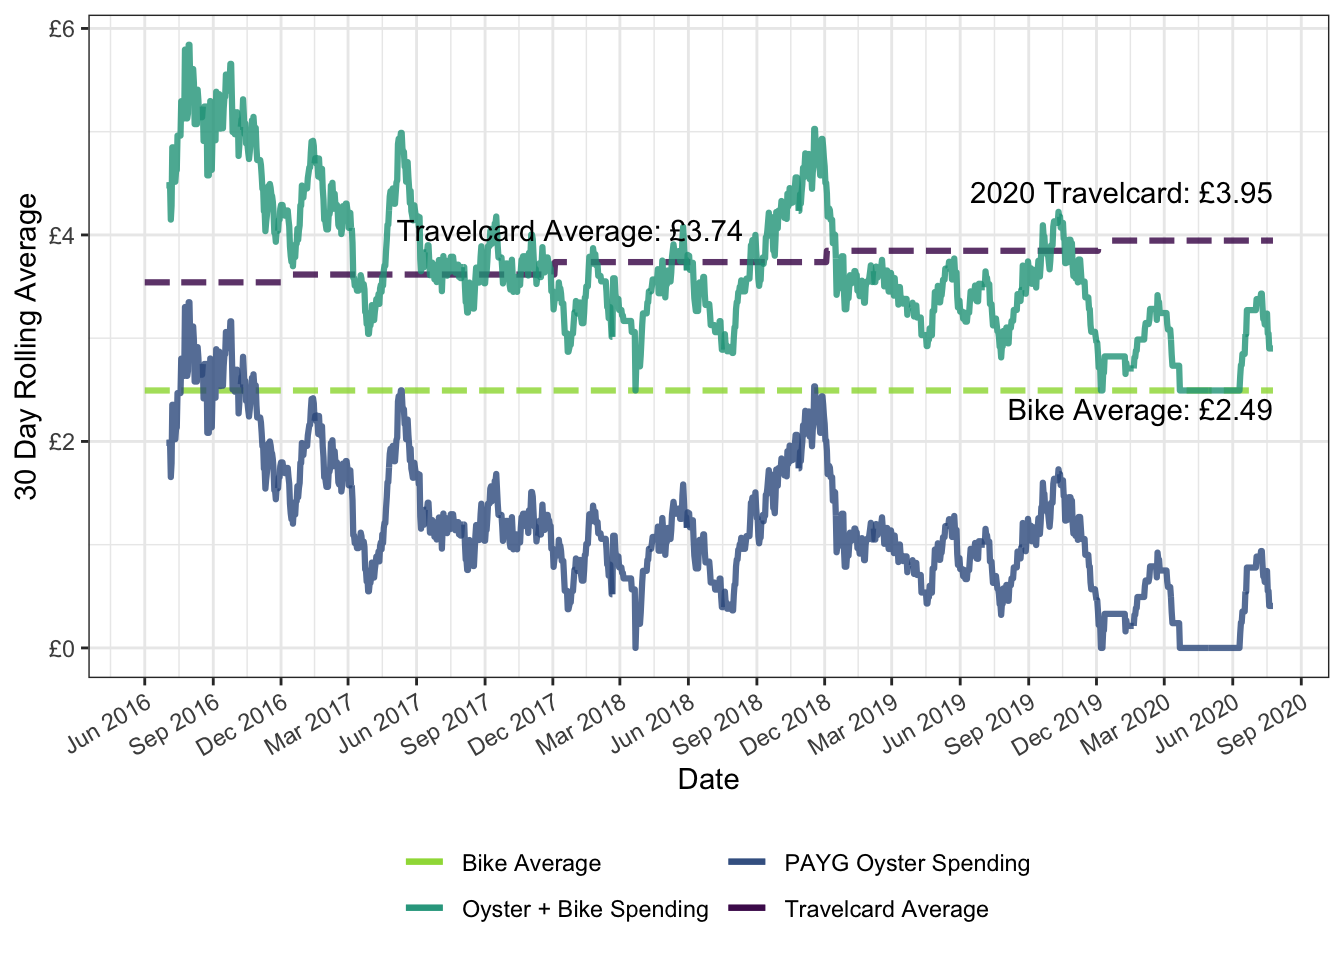
Figure 3: Time series of spending on pay-as-you-go Oyster and cycling, monthly travel card
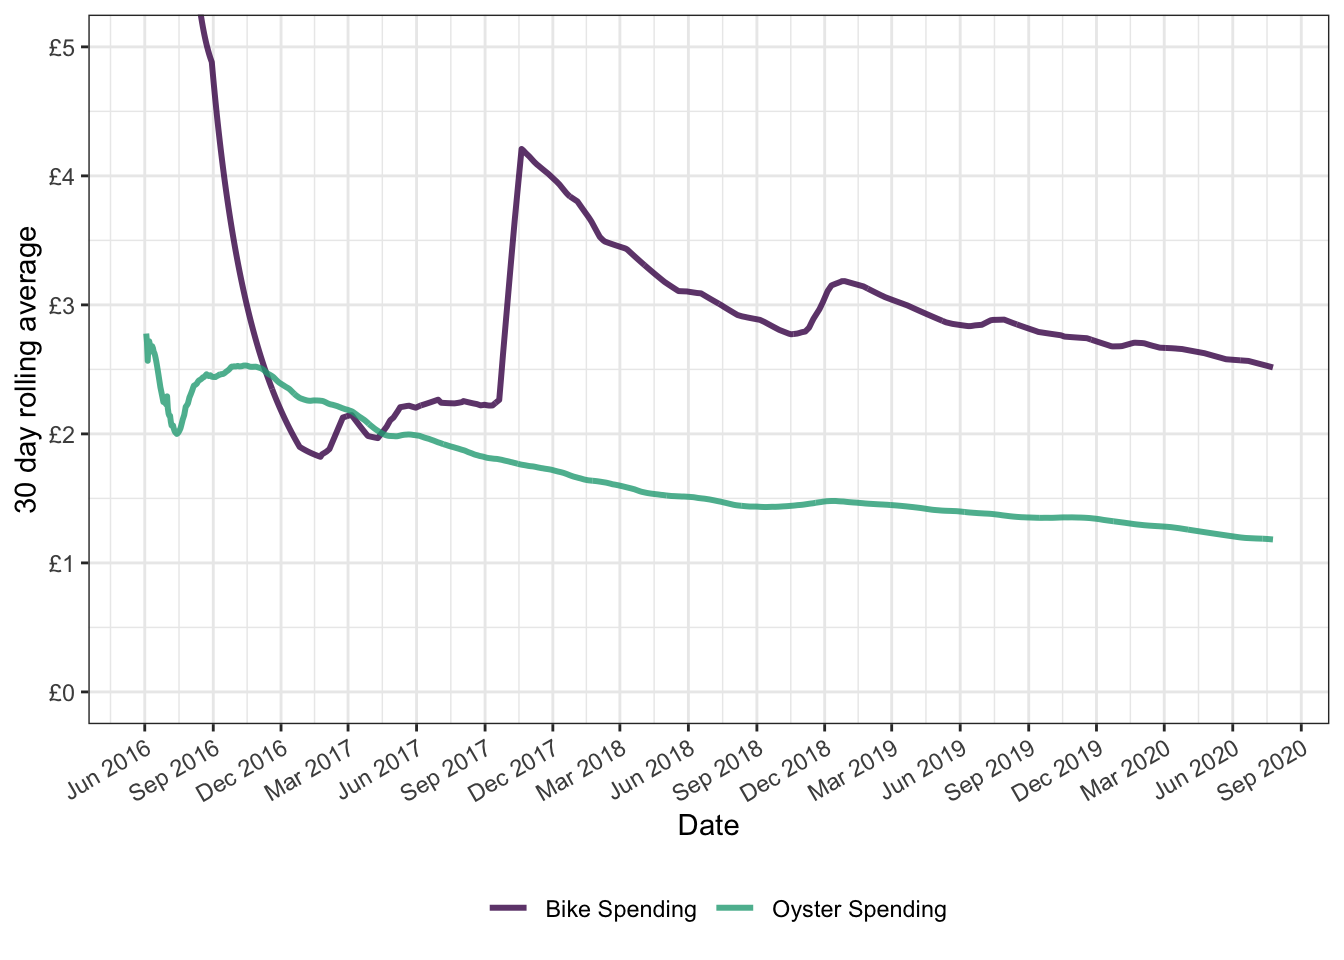
Figures 4 and 5 show the cumulative spending on my bike and my pay-as-you-go Oyster card, and the rolling average cost per day of bike and Oyster spending, respectively.
Figure 4: Cumulative spending in each category
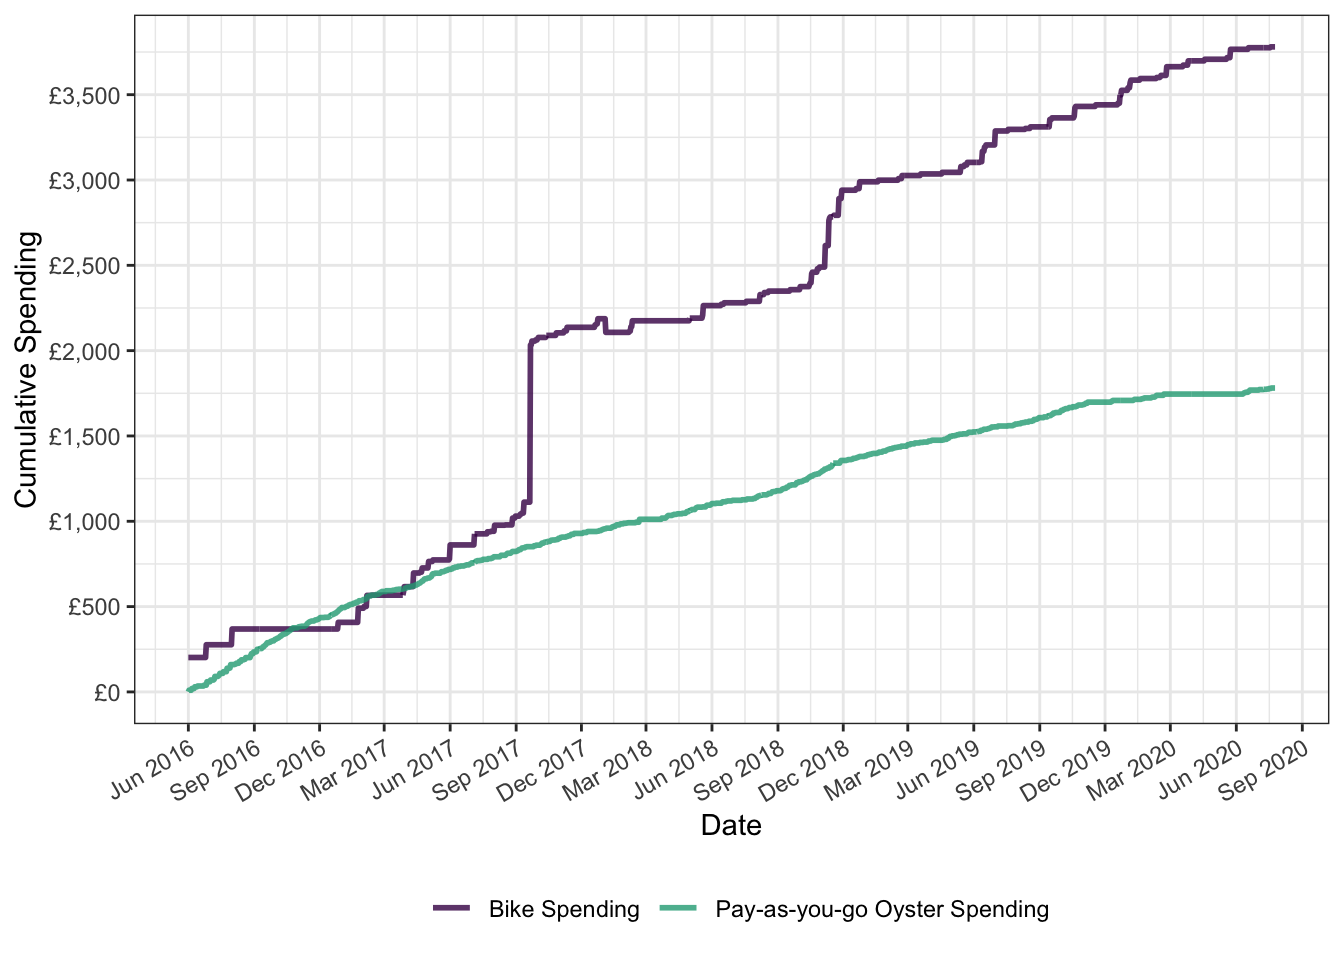
Figure 5: Rolling average cost per day
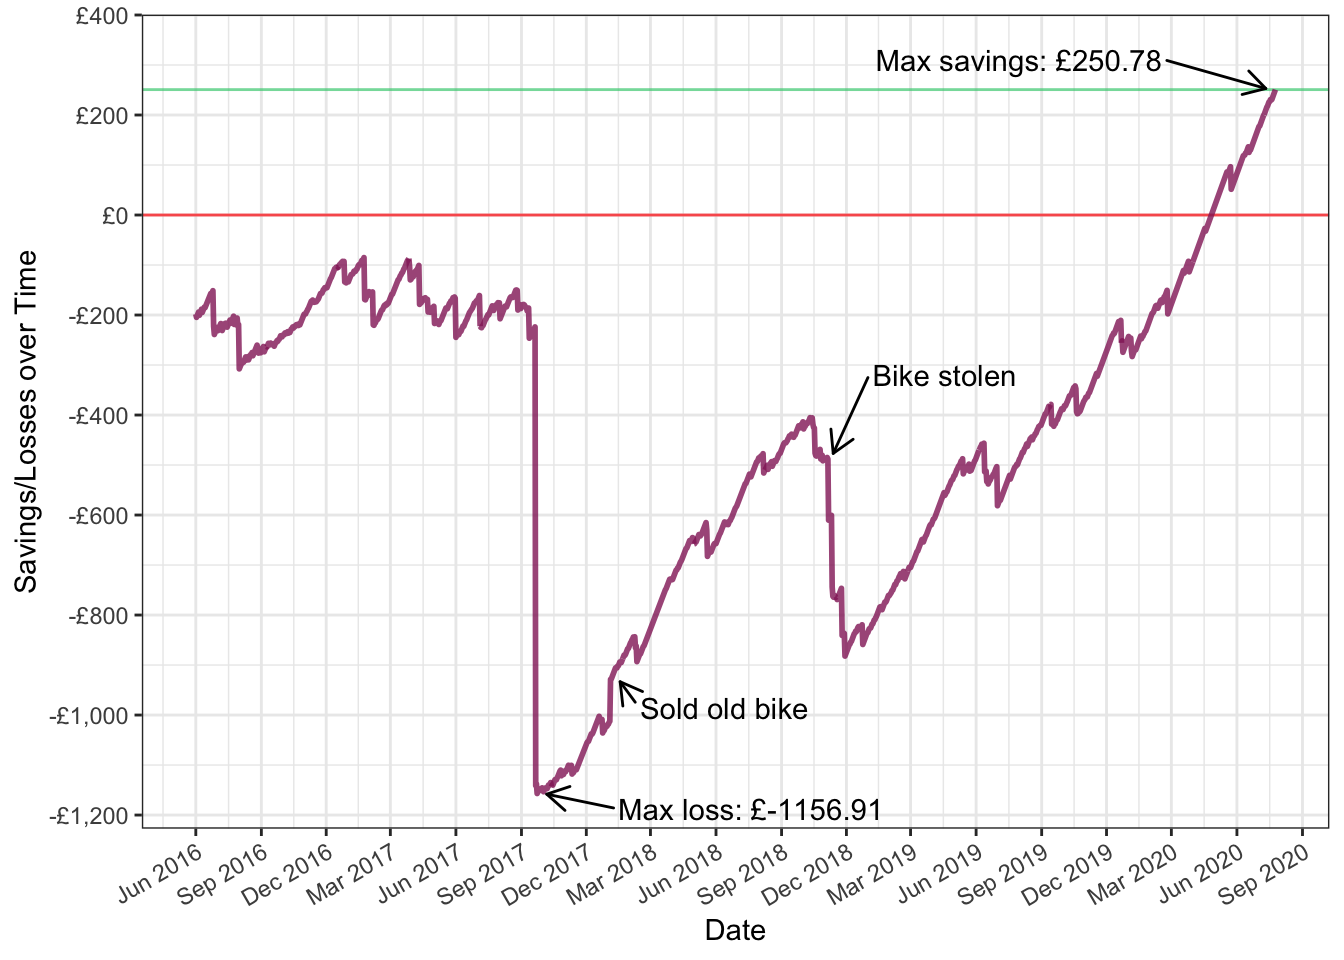
I saved a total of £250.78 over the course of over 4 and-a-bit years (Figure 6), or £0.17 per day, compared to an annual Travelcard. I’m not sure if I would have broken even compared to an annual Travelcard if it wasn’t for the COVID-19 lockdown.
Figure 6: Savings/losses over time, annual travel card
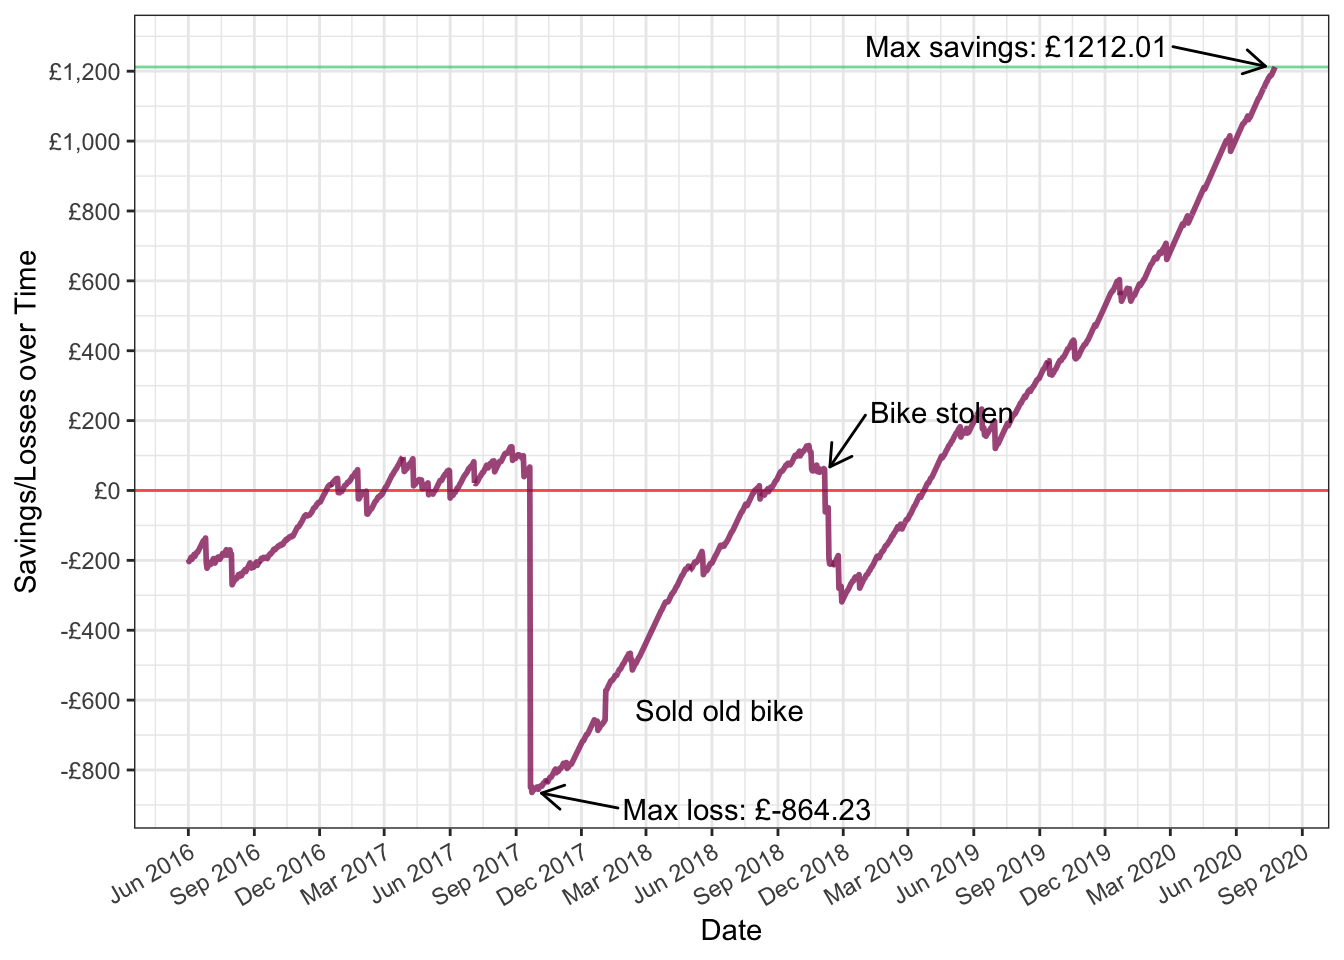
Compared to a monthly Travelcard, my savings are much greater (Figure 7). Over four plus years I saved a total of £1,212.01, or an average of £0.80 per day.
Figure 7: Savings/losses over time, monthly travel card
There are a number of obstacles to an exact cost comparison of cycling and public transport. For example, if I went on holiday for a couple weeks, I could try to time my travelcard renewal so I’m not paying anything while not in London. There are also the intangible benefits of exercise and faster commutes from cycling, compared to the convenience and low effort required of public transport, and any purely financial comparison misses those factors. I don’t know how you calculate the cost of occasionally showing up to meetings soaked with sweat or rain, and that also likely depends on the type of meeting – working in the charity sector I got the impression people were more likely to be impressed by my commitment to sustainable transport than put off by my occasionally showing up out of breath or soaked from the rain.
It is also worth noting that I had a railcard that reduced the cost of off-peak pay-as-you-go fares by 1/3rd for most of the time covered in this comparison.
The code used here is available on GitHub.
For instance, I have bought a couple pairs of commuter trousers for cycling and include that spending in my calculations, less £40 to represent the price of a standard pair of men’s trousers, on the basis that I would have had to buy new trousers anyways.↩︎