Transport for London has produced this brilliant dataset on Public Transport Accessibility Levels (PTAL). It uses the walking time to transport services, the frequency of those transport services, the number of different servicse available, etc, to produce a score and a banding level for every part of London, including for every Lower Layer Super Output Area (LSOA) in London.
I was curious how this matched up with housing prices, so I grabbed price paid data from HM Land Registry and set off. The land registry includes the postcode of the property, as well as its type (detached house, semi-detached house, terrace houses, flats, and other) and selling price, amongst other data. Price paid data is available back to 1995, but I just took last 5 years, covering 1 September 2012 to 31 August 2017. I matched postcodes to LSOAs using Chris Bell‘s fantastic postcode datasets, and took the average selling price per LSOA by property type.
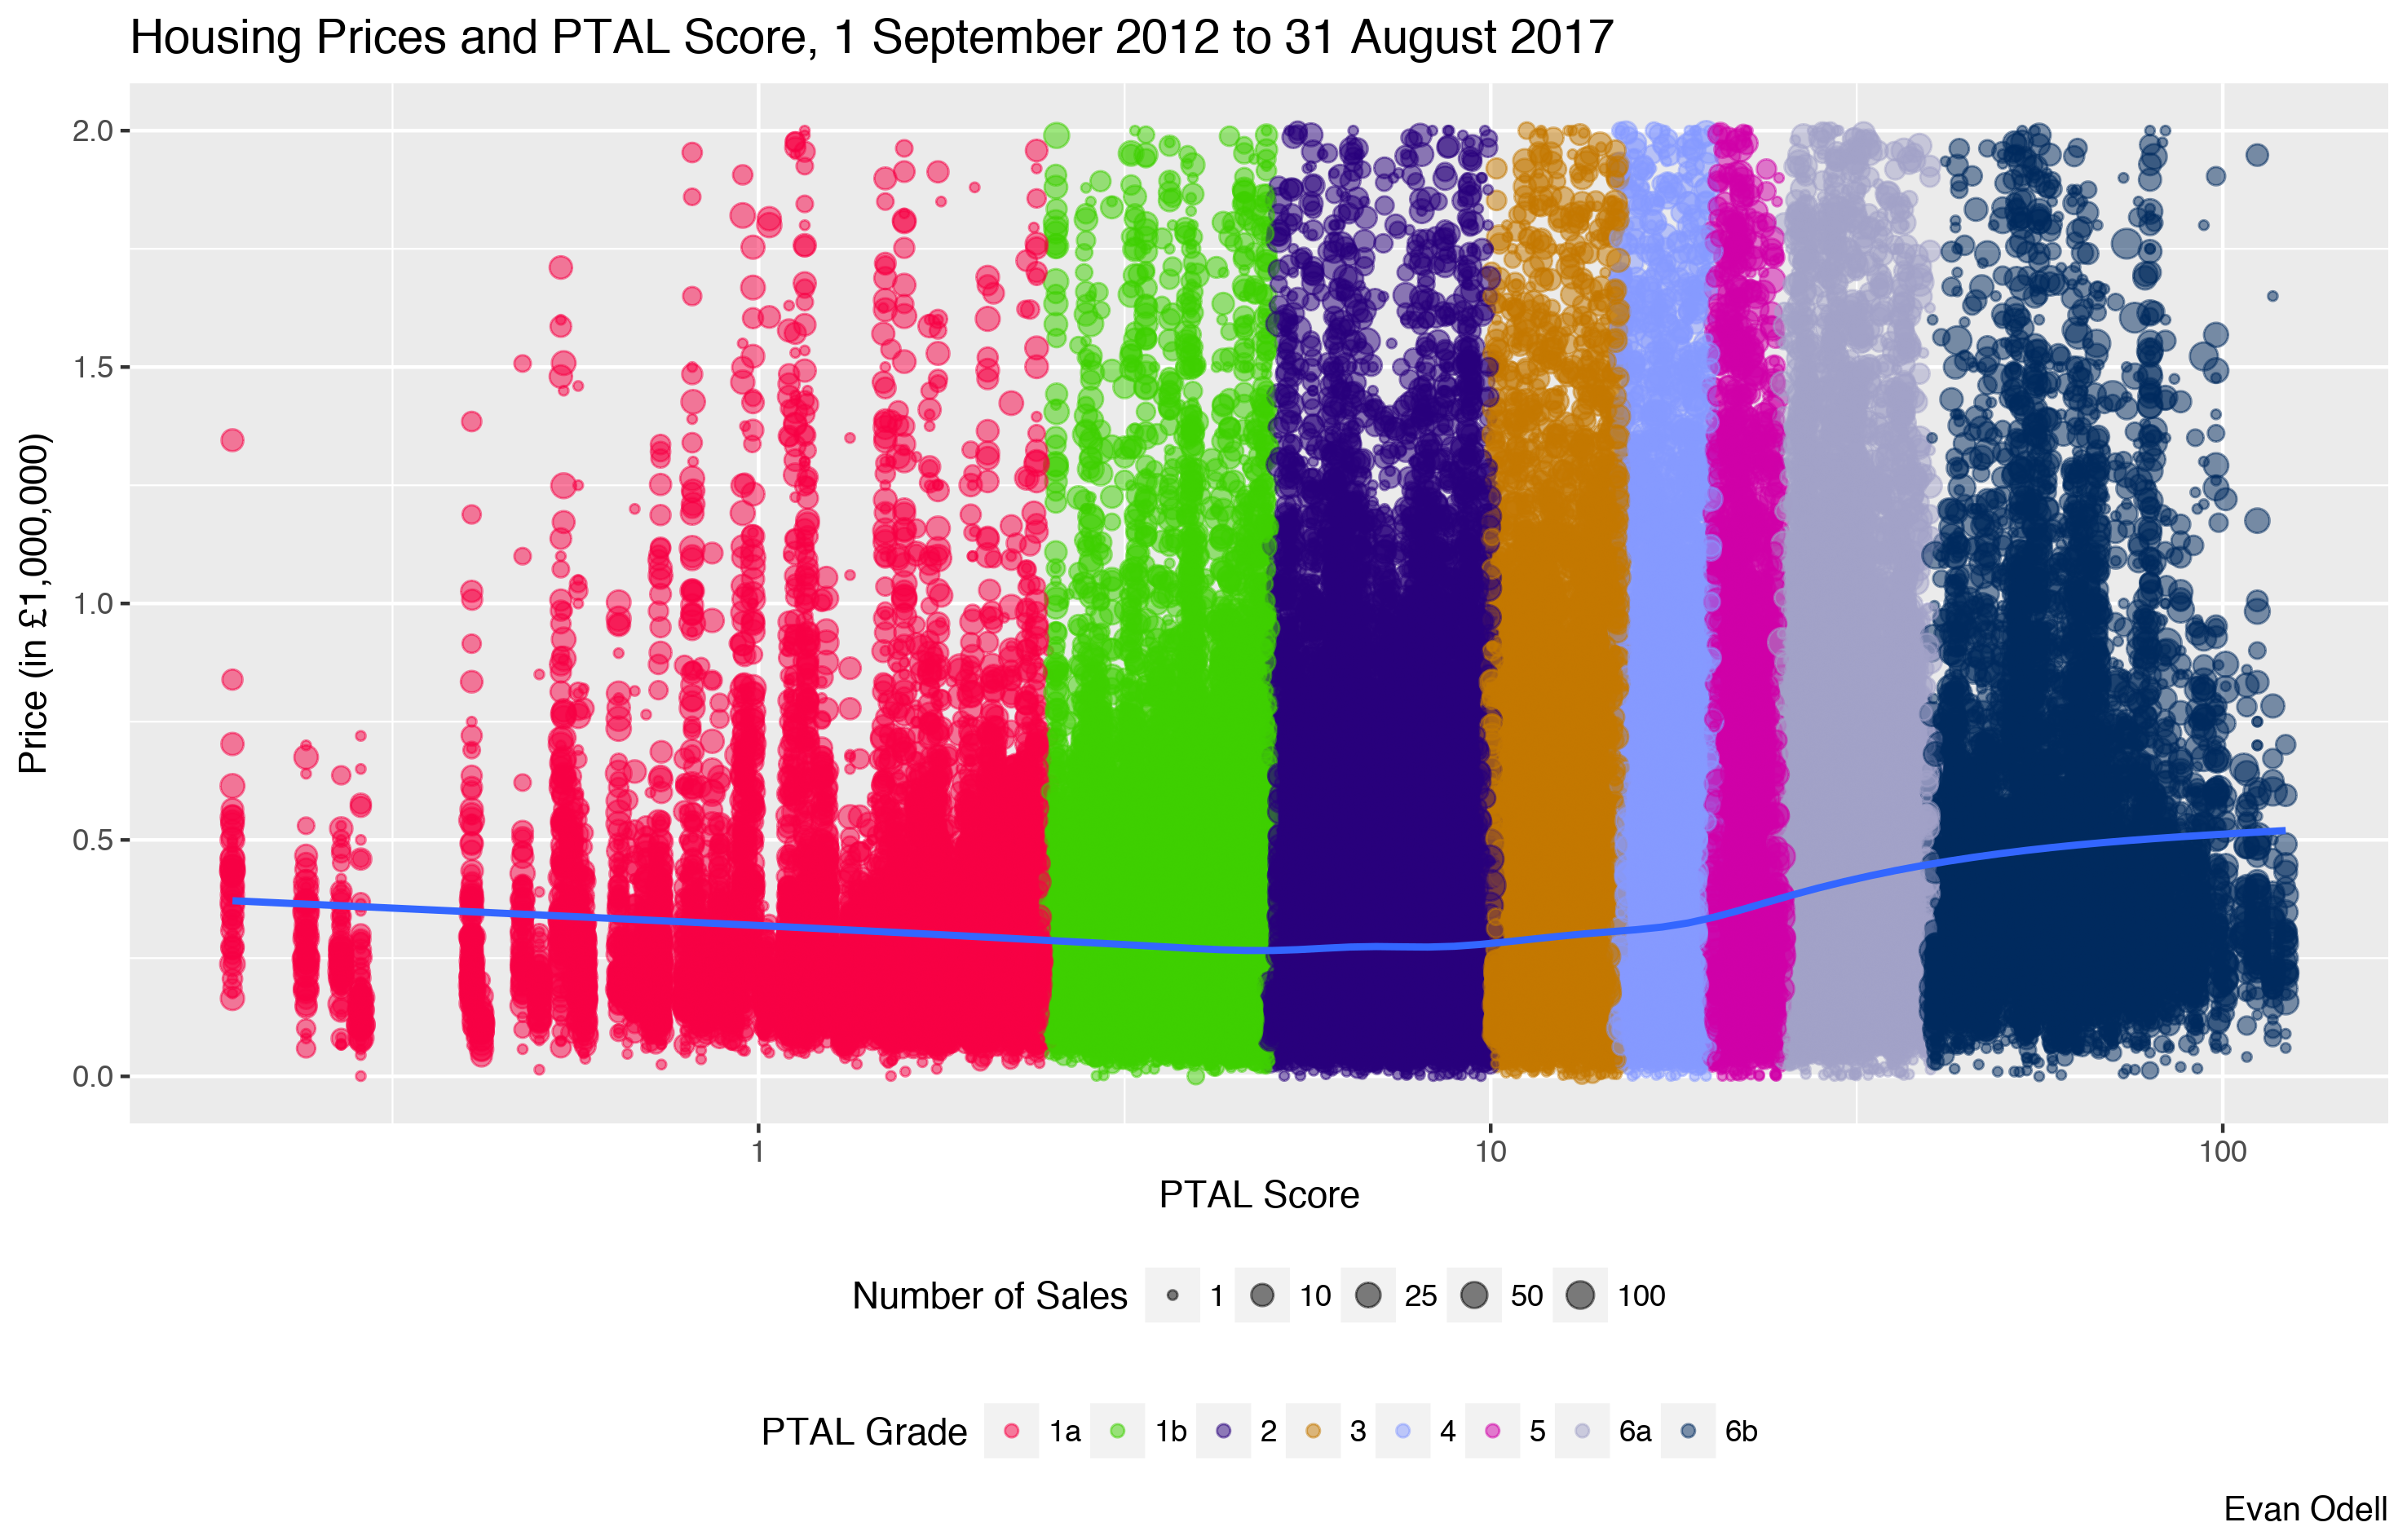
I dropped “Other” property types and sales where the property type was not recorded, as well as properties with sale prices over £2 million, to avoid messing up the scale, and to limit the houses to ones that might actually be affordable to ordinary people.1 Points in the plot are scaled based on the number of transactions in the LSOA over the time period covered. First, here is the sale price of all housing sales over the last five years. The x-axis is the PTAL score, the y-axis is the price and the points are coloured by the PTAL grade assigned by TFL. The data is very dense, with 143,814 data poinst, so the trendline is particularly necessary.
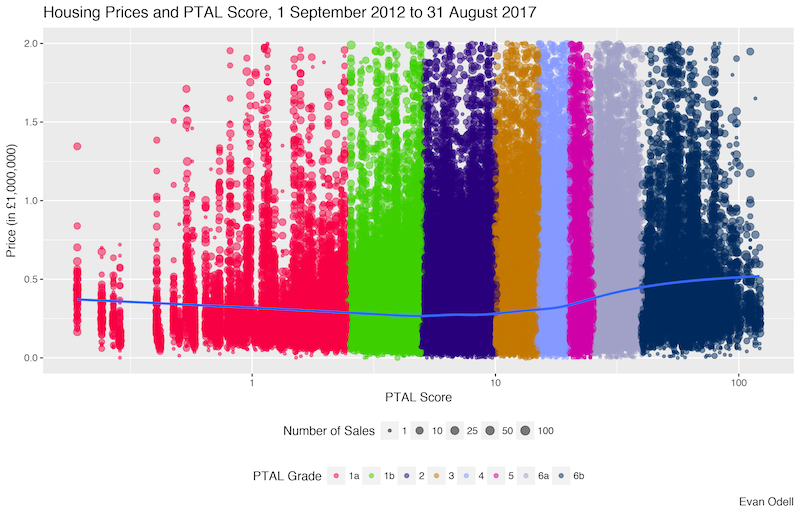
Housing prices start to increase across all housing types in the middle of Grade 2. Areas with the lowest grades of accessibility are largely car dependent suburbs; it makes little difference if the bus at the stop a ten minute walk from your house comes every half hour or every 45 minutes, few people would rely on it as a mode of transport.
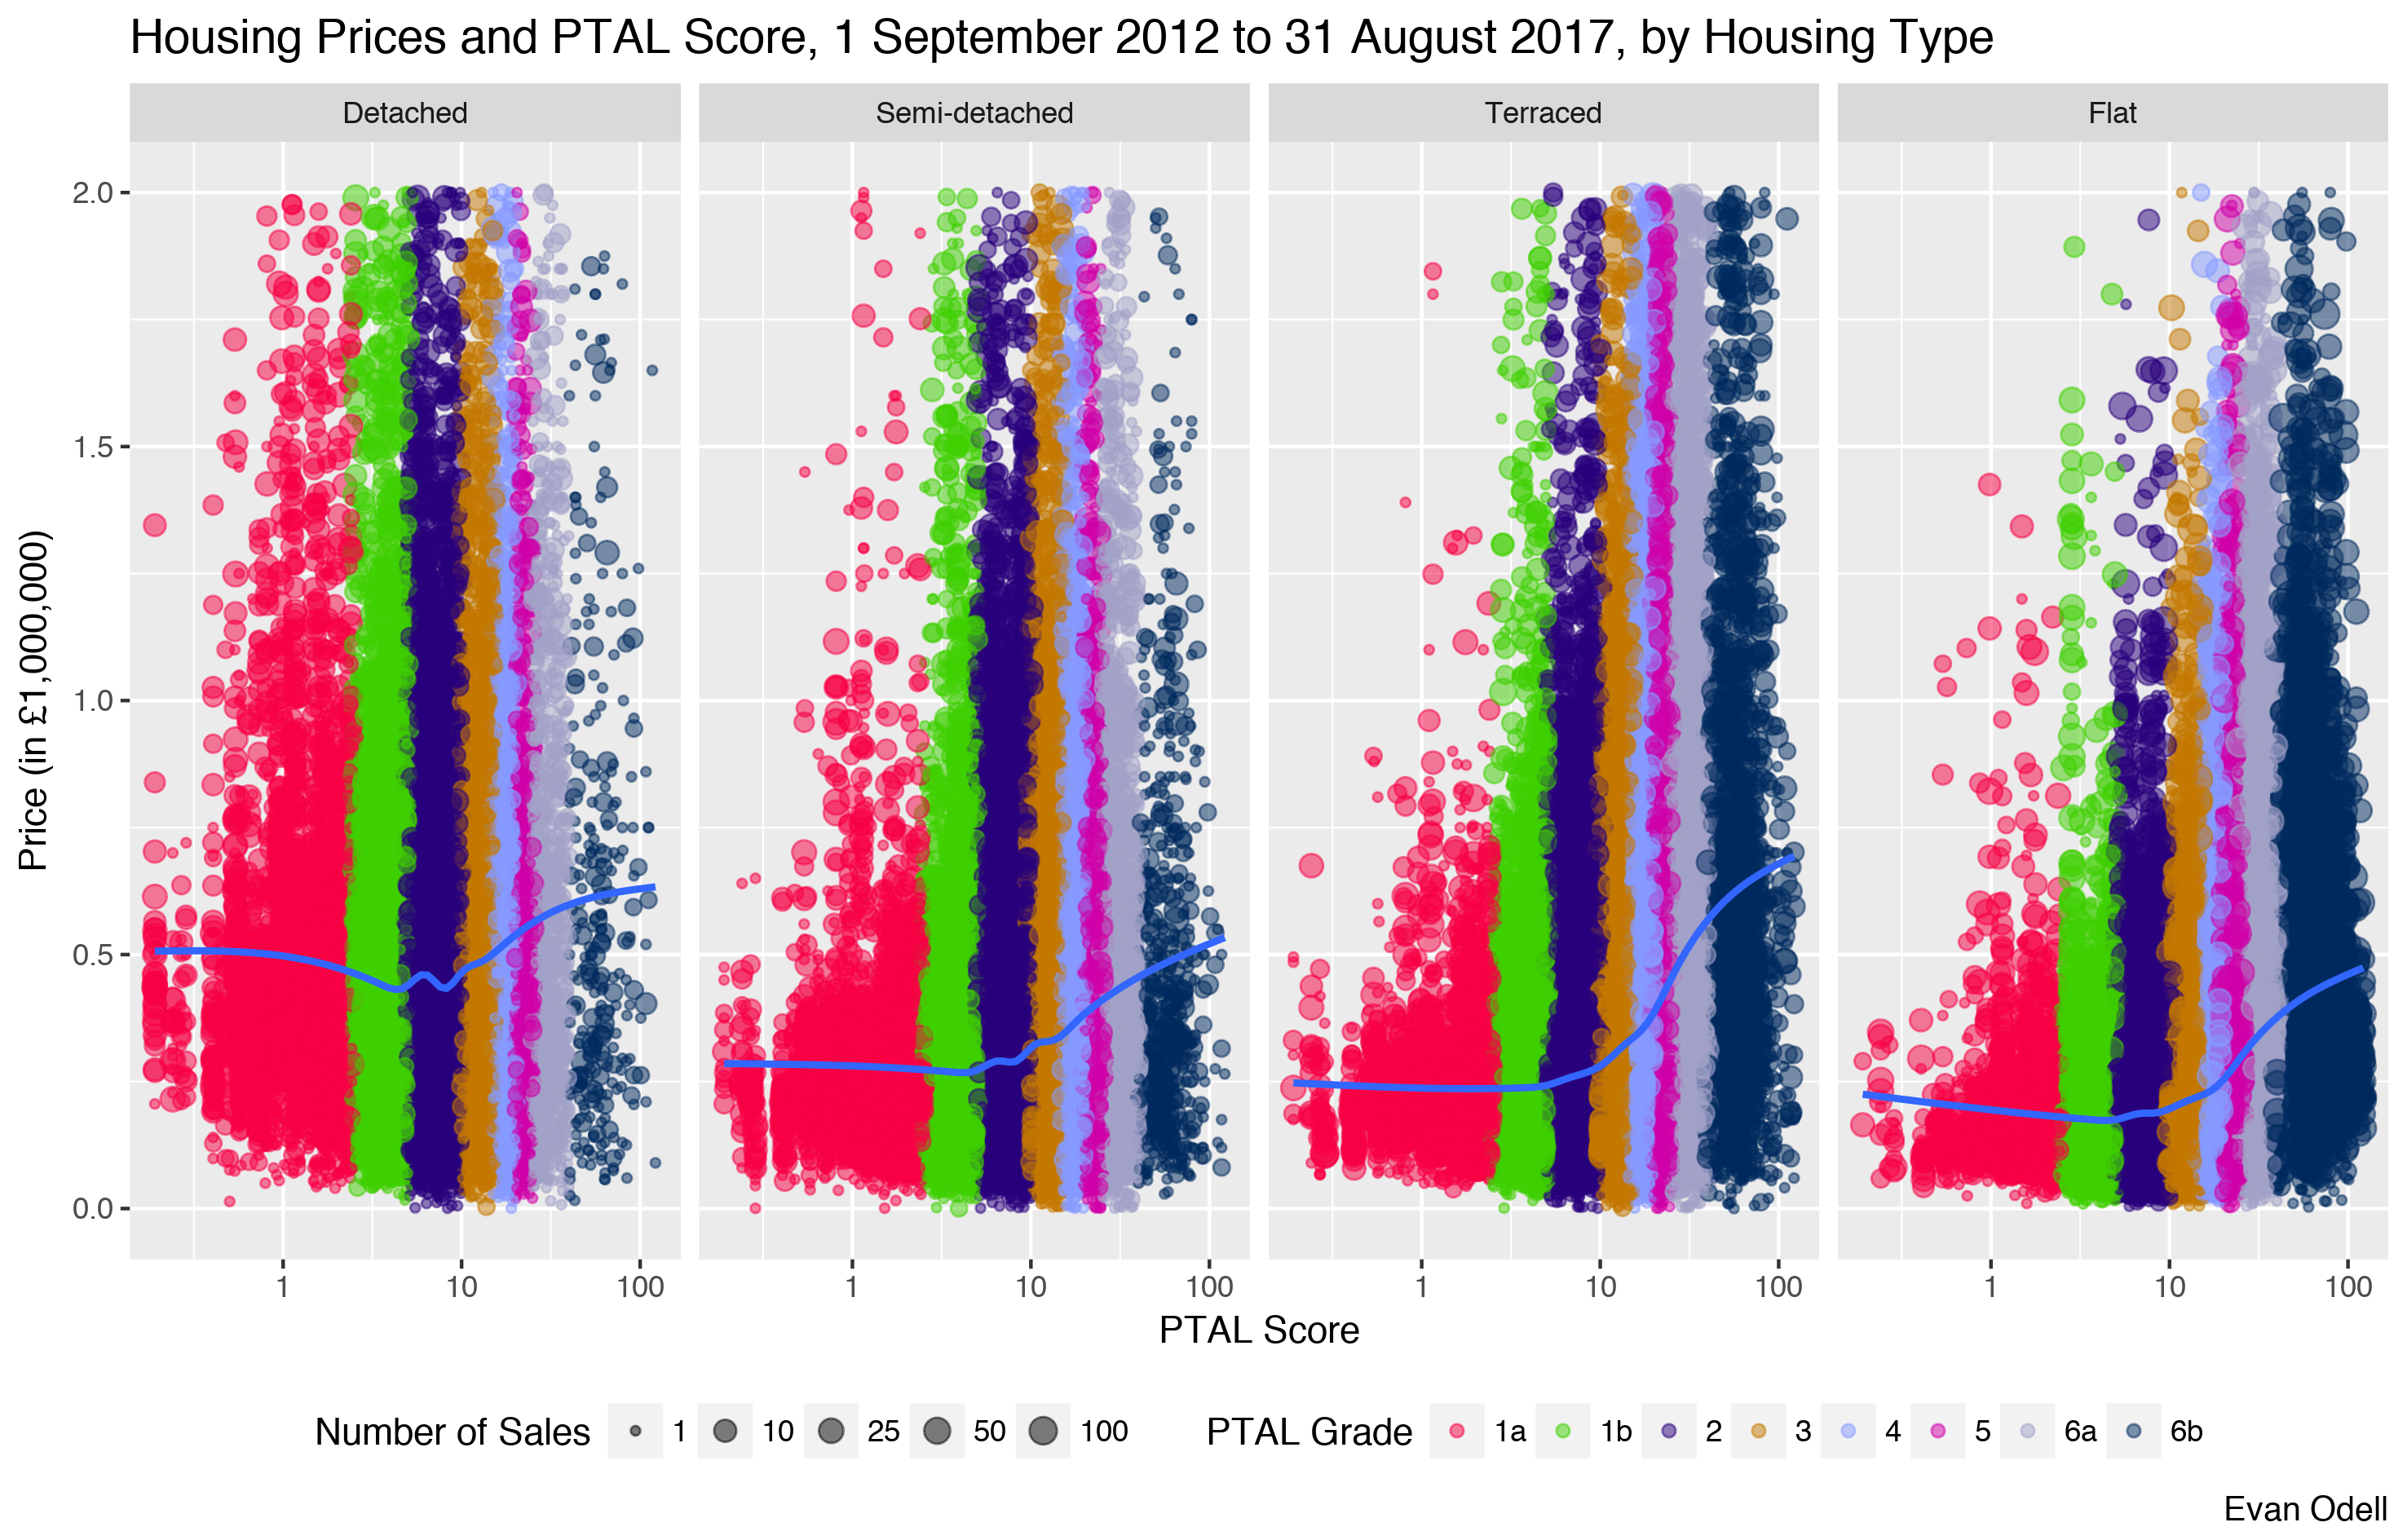
It appears that large numbers of buyers prefer a small, well-connected house to the expansive houses and gardens of suburbia, and are willing to pay more money for less property to achieve that. It is more than an easier commute, it is the easy access to local services and social activities provided by higher density houses. There is a large body of research that shows people living in higher density areas are healthier and happier;2 being able to easily see your friends or buy bread is more important than having an expansive house and garden.
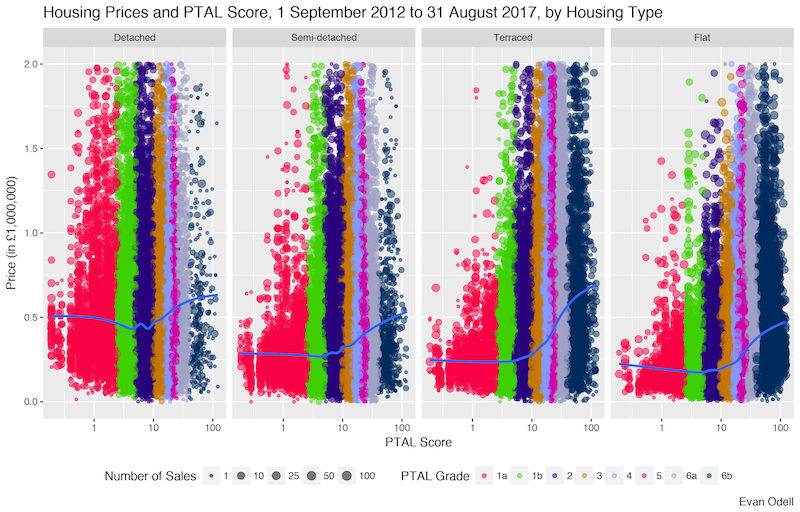
There are very few detached or semi-detached houses in areas with the highest grades of transport accessibility, or at least not many within our £2 million price range. Flats in the lowest grades are typically the most affordable, and the relative increase in the price of terraced houses and flats outstrips that of detached or semi-detached homes. In fact, there have been no detached houses sold in the highest grade of transport accessibility (6b) in the first 8 months of 2017, and only 20 sold in 6a, the second highest grade. Due to the high density required to achieve this level of connectivity, and London’s extraordinarily high land prices, it is astonishing that there are any detached houses available at all.
It is also interesting to note the apparently steeper increase in price in more acccessible locations in 2017 alone, compared to 2012–2017.
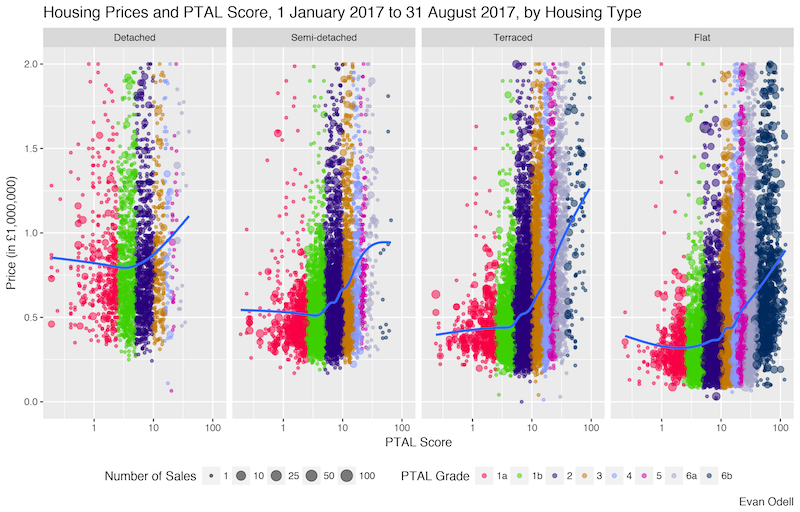
I have not accounted for the size of houses in different areas, or the quality of those properties.3 Even in 2017, there were numerous properties available in 6b and 6a for under £500,000, although they are largely flats or terraced houses. There are even flats available for under £250,000, although they are likely small one-bedroom or studio apartments.
Addendum 20 October 2017
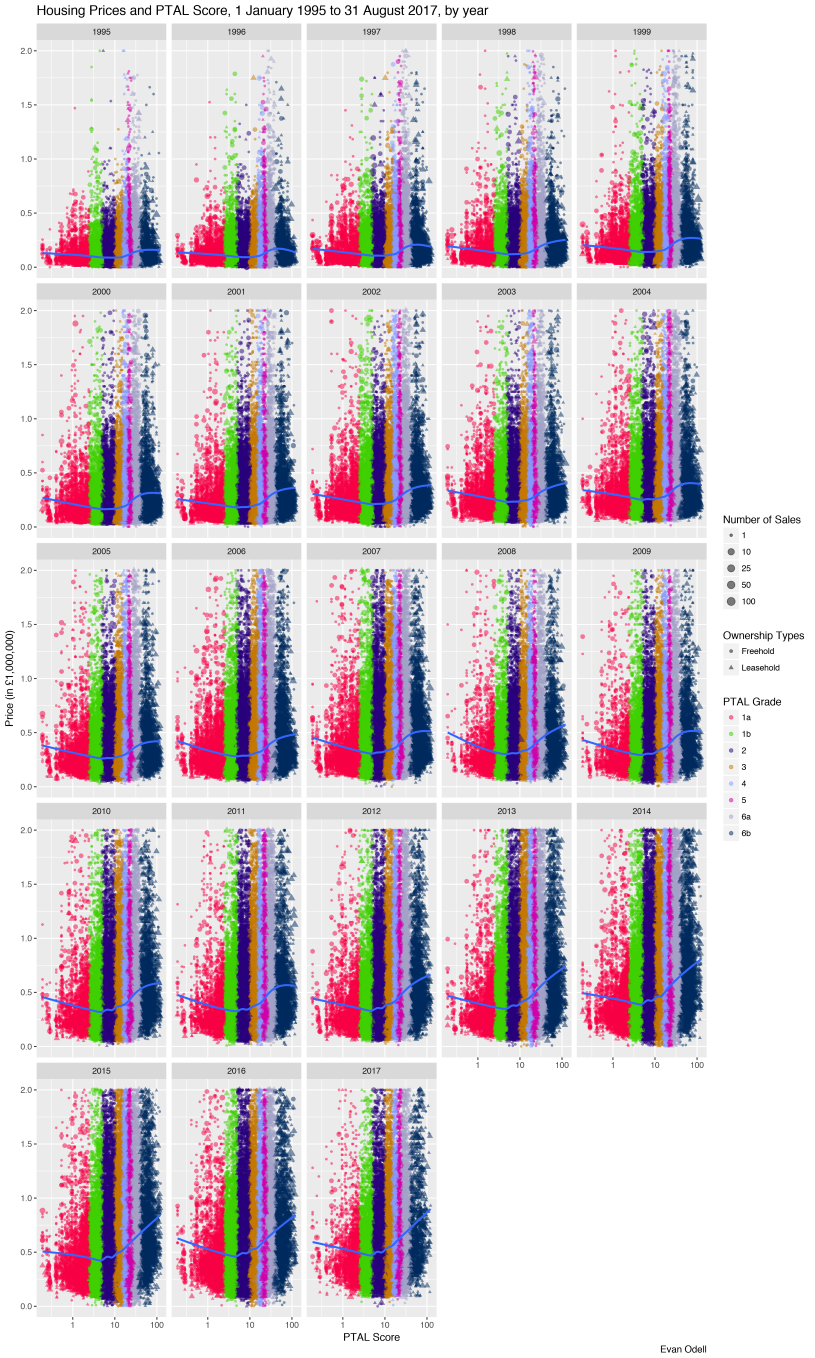
After first writing this blog I got curious about how consistent over time the trend of higher transport accessibility equalling higher prices is. The chart below shows housing prices by PTAL from 1995–2017, and you can clearly see that now there is a much higher link between high accessibility and high prices. Of course, the transport network in London is very different now than it was in 1995, and so a place that is currently rated as having excellent transport links could have had very poor and infrequent services in the 1990s (as I’ve only used the most recently available PTAL data).
It is also clearer in this graph that in almost every year the lowest prices (from which we can infer the least desirable place to live) is not the least accessible part of the city, but rather grades 1b and 2.
Be sure to click through to the full image. I’ve also divided between freehold purchases (circles) and leaseholds (triangles). I haven’t divided by housing type (yet).
Data Sources
-
PTAL scores by LSOA from TFL.
-
Postcodes from Chris Bell
-
Price paid data from HM Land Registry. I downloaded the complete dataset and subsetted it. I used the smaller 2017 dataset to get used to the data and produce the 3rd image in this post.
Analysis
I extracted the price paid data I wanted for London from with Python. Other analysis and visualisation was done in R. The code is available on Github.
Notes
-
Not that the income of anyone who can afford a £2 million house is ordinary. ↩︎
-
E.g. this recent paper by Sarkar et al. in The Lancet. ↩︎
-
I will get to that in a future post. ↩︎