I’ve been playing around with panel data from the British Election Study,1 looking at how disabled people voted in the 2016 EU referendum and the 2017 General Election. I’ve previously posted the graphs on Twitter, but these ones look a bit nicer, and I’ve included more independent variables in the regression table of disabled votes in the 2017 General Election.
2016 EU Referendum
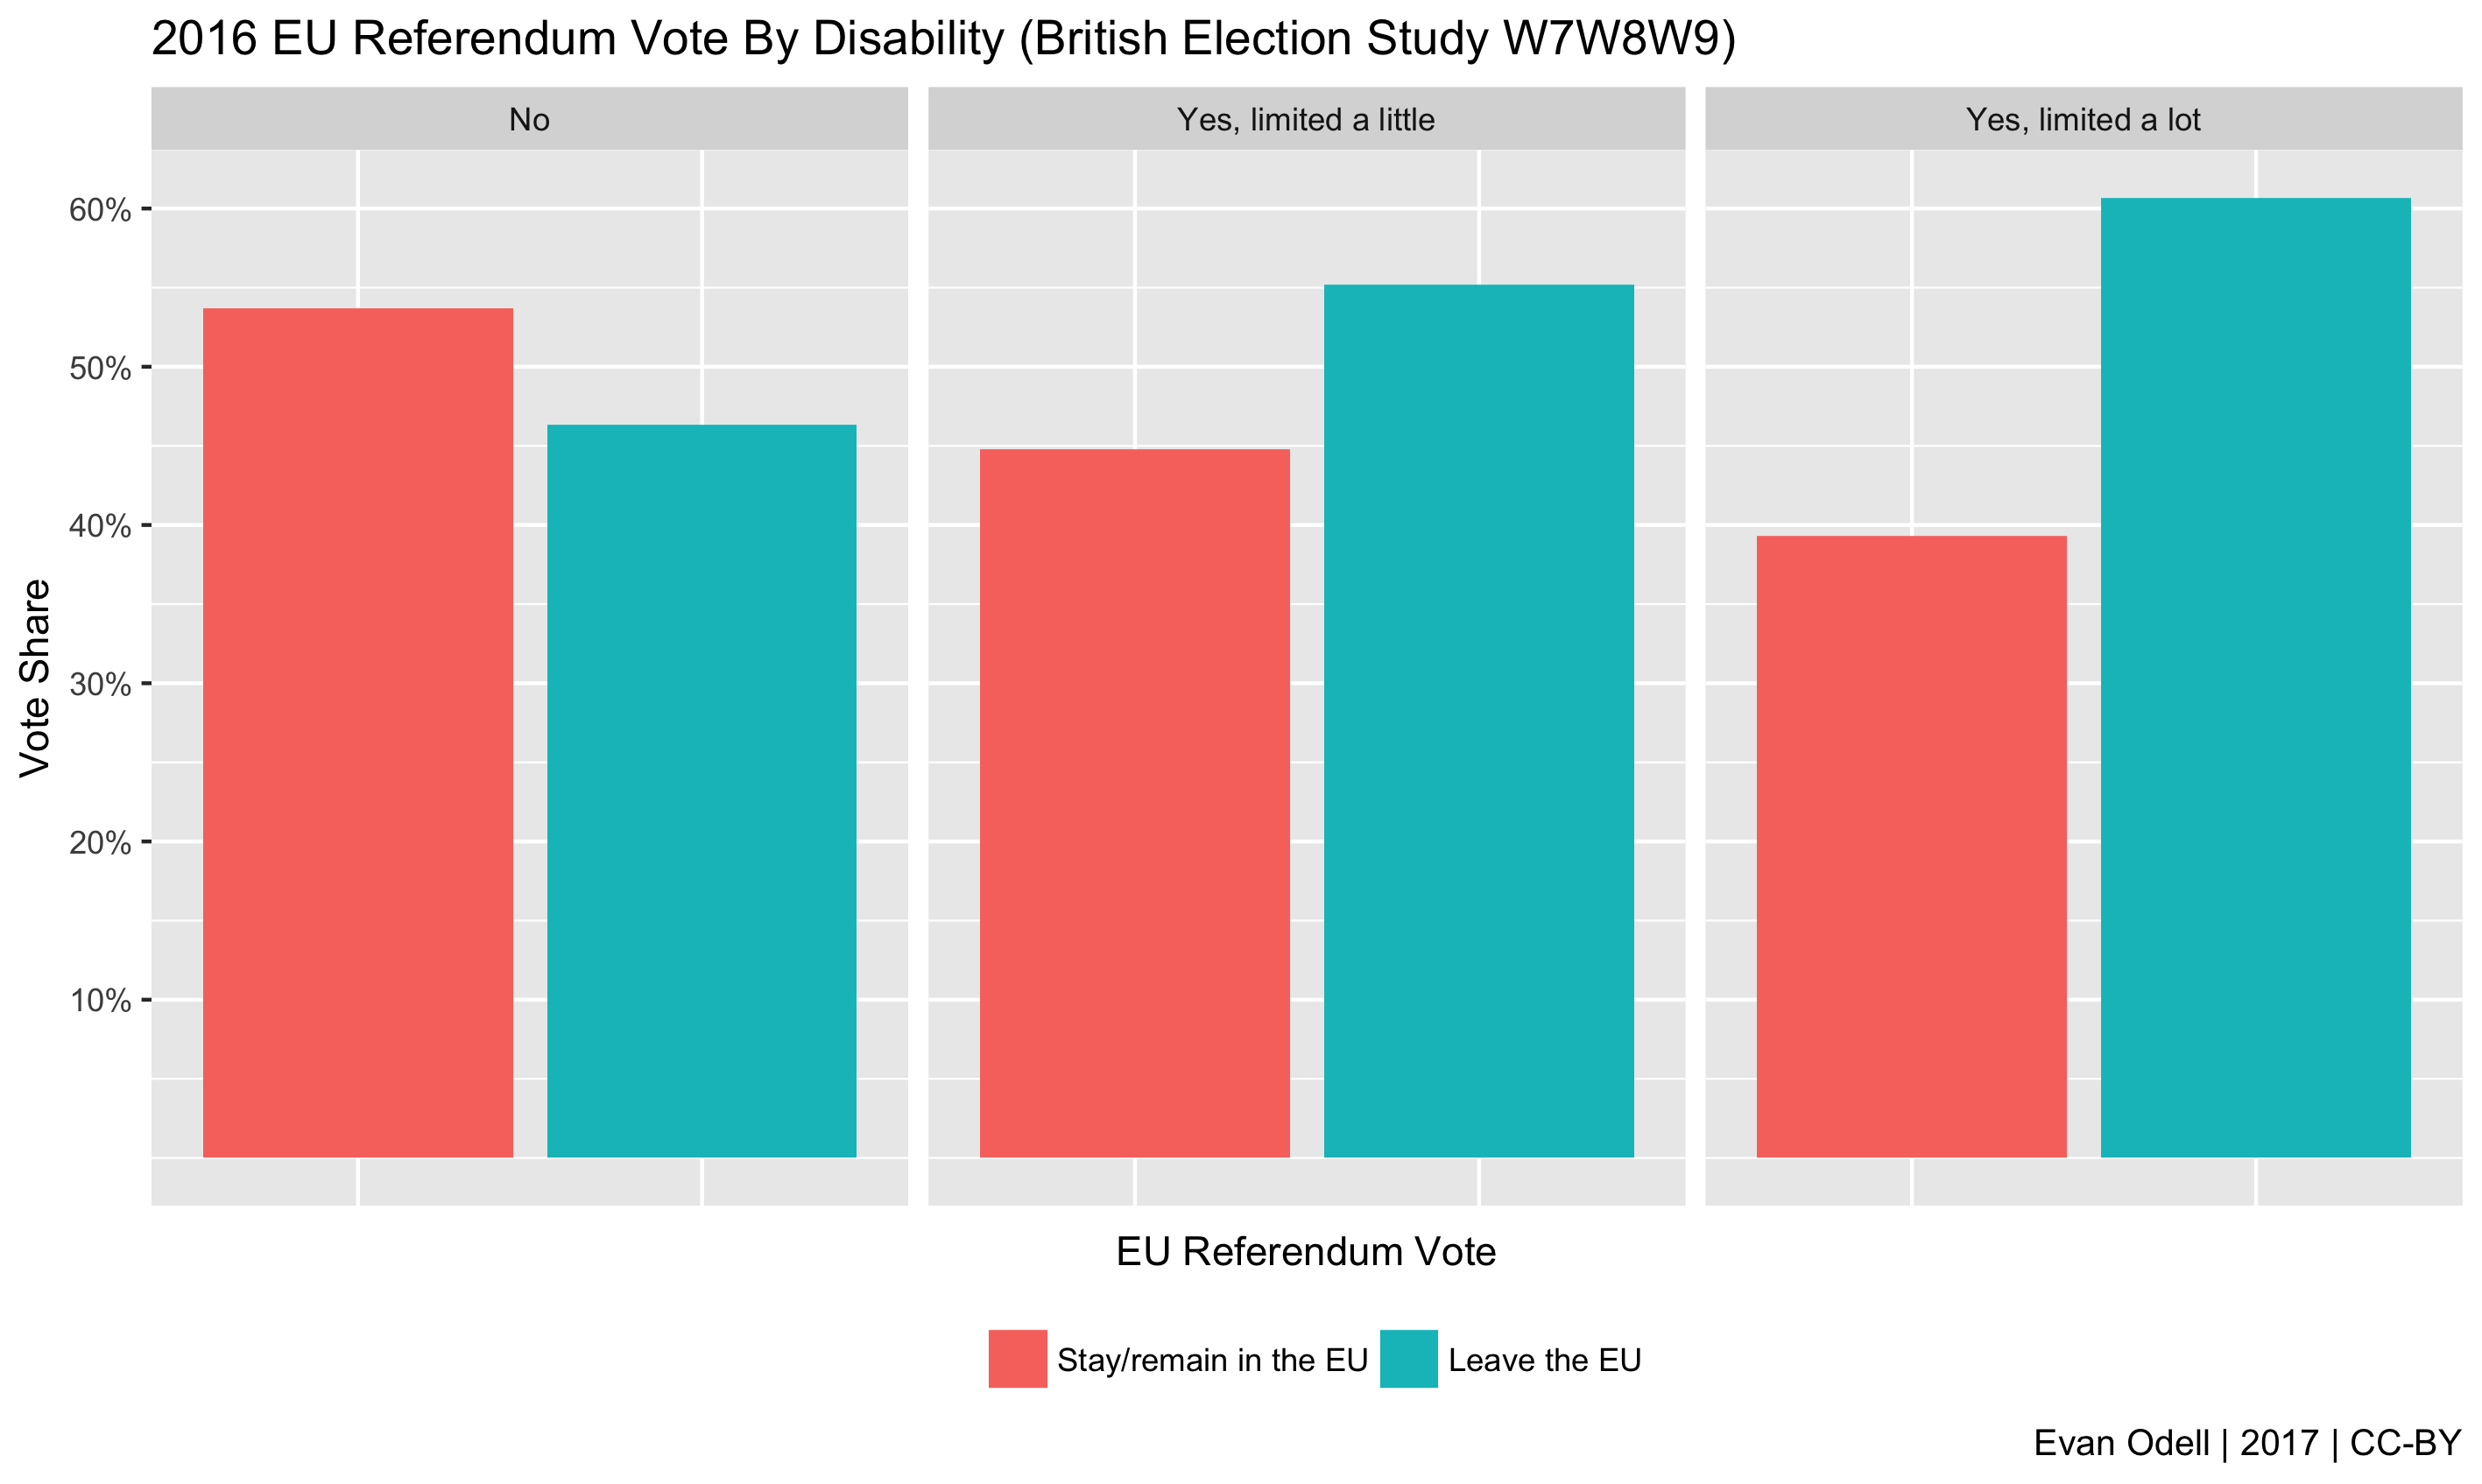
Disabled people voted to leave the EU; in the case of people with more severe disabilities, over 60% of people voted leave. Given the correlation between disability and age, this is not unsurprising. The older you are and the lower your educational attainment, the more likely you are to be disabled, and the more likely you are to have voted leave. This is at odds with the views of the majority of high-profile disability activists and campaigners, as well as Disabled Persons Organisations, who backed remain.
I wanted to isolate disability from other demographic factors, so I used a Gaussian generalised linear model (GLM) in R to predict remain vote, with data from Waves 7, 8 and 9 of the British Election Study.
What is more surprising is that even when controlling for age, university attendance and social class, disabled people still voted to leave the EU. Having a disability that imposed some day-to-day limitations correlates with a 2.8% drop in remain vote, compared to non-disabled people of the same age, university attendance and social class (based on the social grade of the household’s chief income earner), while more limiting disabilities correlate to a 7.7% drop in remain vote. This outcome supports the idea that for many people voting leave in the EU referendum was an expression of discontent and frustration with the status quo.
Table 1 - Voting remain, by disability, controlling for age, university attendance and social class
2017 General Election
On the whole, people with less-limiting disabilities were more likely to vote for the Conservatives than non disabled people in the 2017 General Election. A plurality of people with more limiting disabilities voted for Labour, were the most likely group to vote for UKIP, and the least likely to vote for the Liberal Democrats.
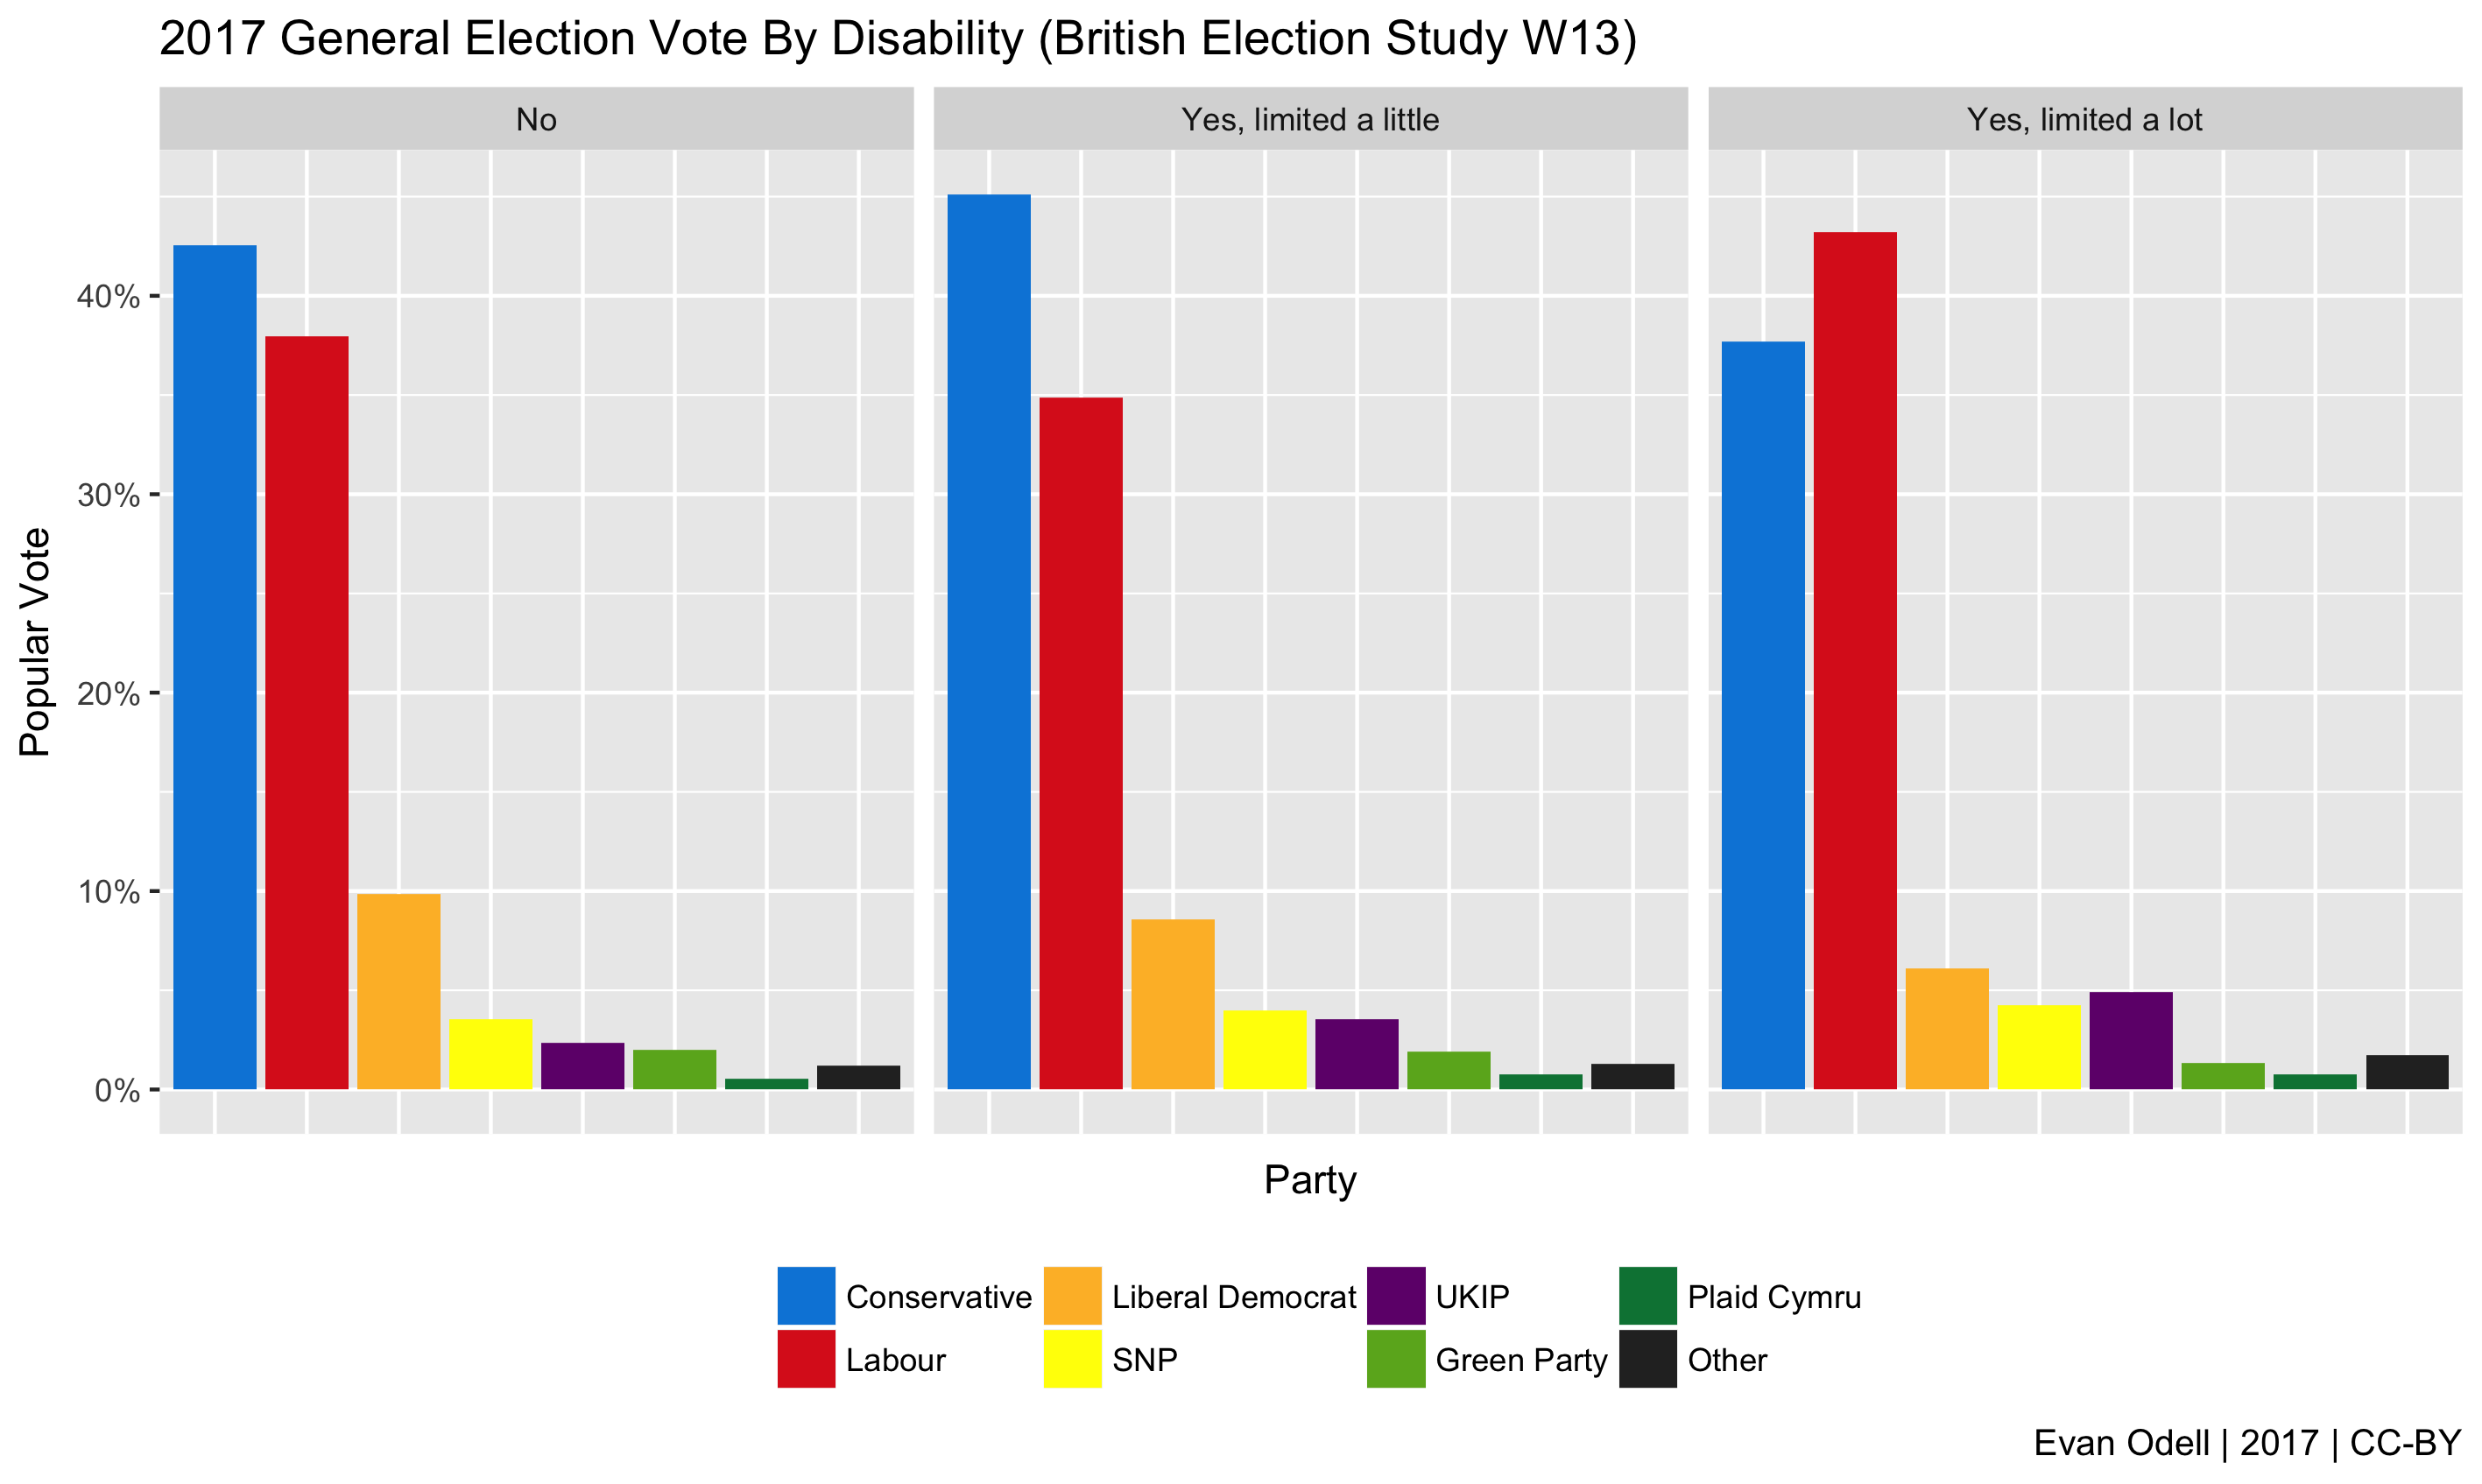
I wanted to see if there was any relationship between being disabled and voting for Labour compared to all other parties, as the Labour party seemed to be making the most explicit appeals to disabled people on issues like benefits and social care. Again, I used Gaussian GLM in R, which found that disabled people were more likely to vote for Labour than non-disabled people, controlling for age, university attendance and social class. As expected, older age was associated with a lower likelihood of voting for Labour, and lower social class with a greater likelihood of voting for Labour. A more limiting disability correlates with a 7.6% increase in Labour vote, while less limiting disabilities were only associated with a 1.9% increase, relative to non-disabled voters.
Table 2 - Voting Labour, by disability, controlling for age, university attendance and social class
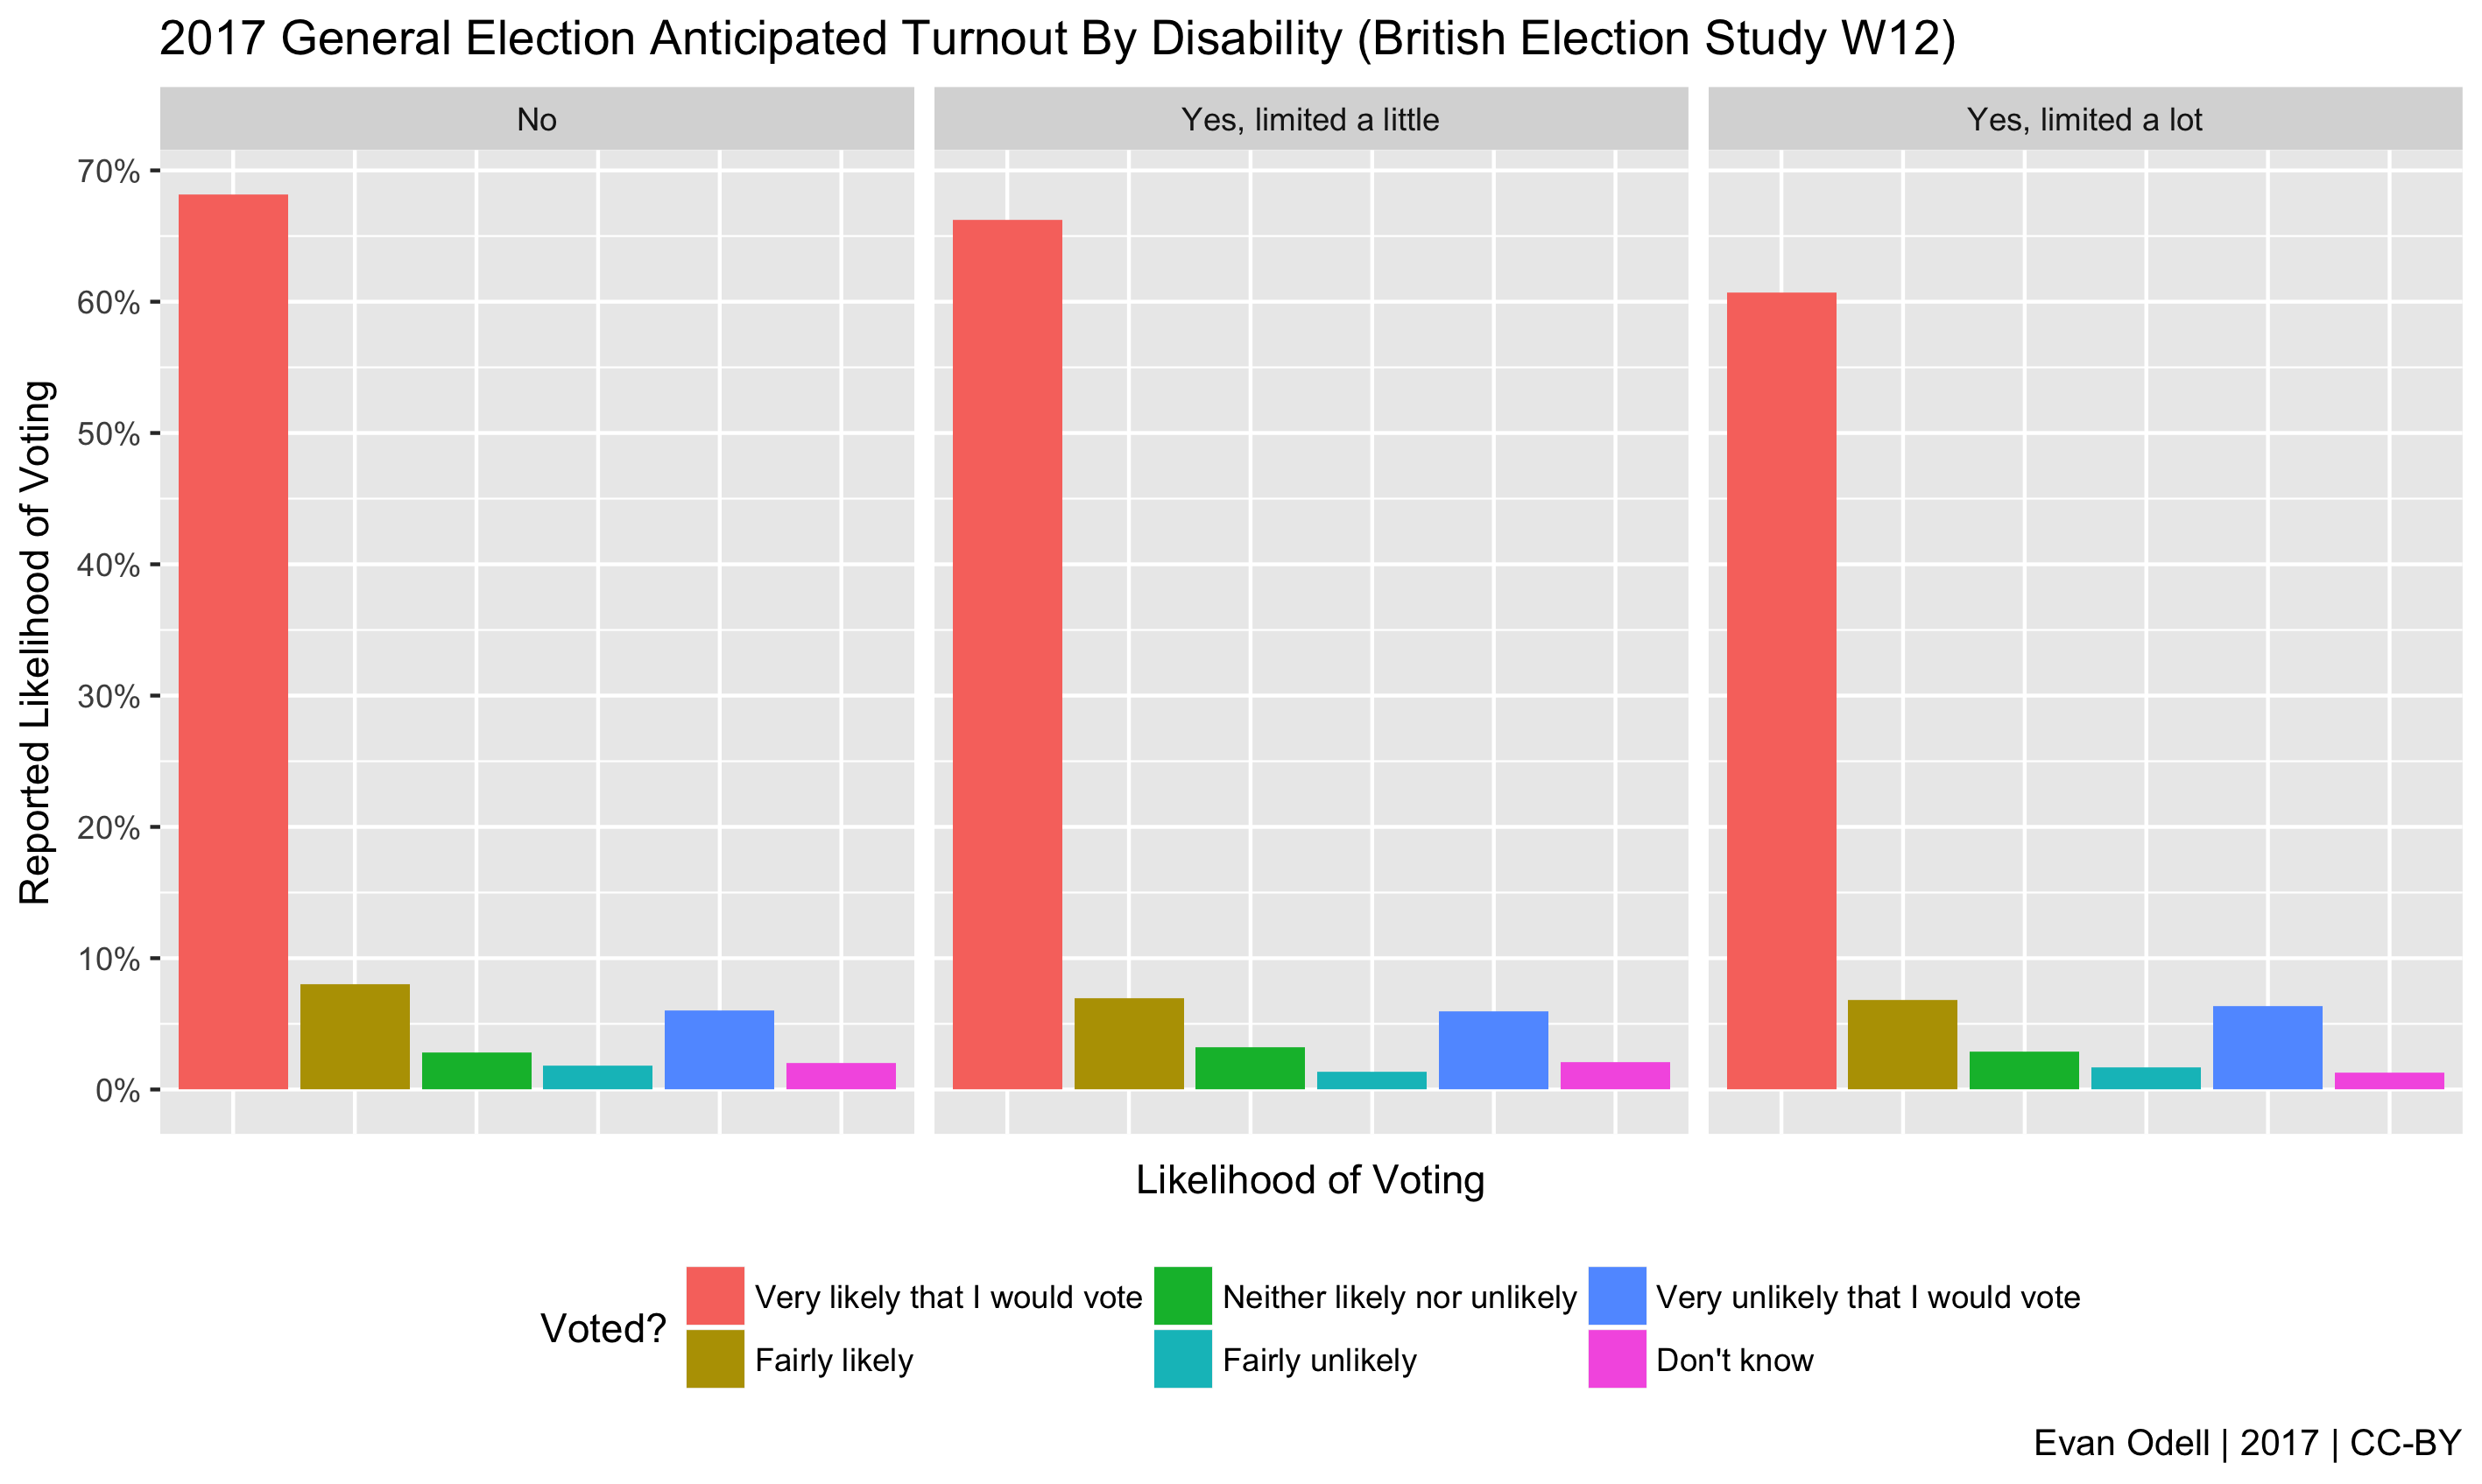
When I posted these graphs on Twitter last week, and in response to people reporting barriers to voting because of their disability, Neil Crowther asked if there was anything on voter turnout amongst disabled people:
@evanodell do you have anything on the comparative proportions of the disabled electorate who voted compared to the electorate overall?
— Neil Crowther (@neilmcrowther) November 10, 2017
I used turnout expectations from Wave 12 of the BES,2 conducted in the midst of the 2017 GE election campaign. Disabled people were less likely to report they were “very likely” to vote; people with more limiting disabilities were less likely to do so than those with less limiting disabilities.
Notes
The code used to create these plots and tables is available on GitHub. British Election Study data from waves 1-13 can be downloaded from here.
Notes
-
Fieldhouse, E., Green, J., Evans, G., Schmitt, H., Eijk, C.V.D., Mellon, J., and Prosser, C., 2017. British Election Study Internet Panel Waves 1-13. http://www.britishelectionstudy.com/data-object/british-election-study-combined-wave-1-13-internet-panel/ DOI: 10.15127/1.293723 ↩︎
-
I couldn’t figure out the turnout data in Wave 13, the post-election wave. If I do figure that out I’ll update this blog; if someone wants to give me some tips or point out some variable I seem to have missed, please get in touch. ↩︎