In line with a previous post summarising disabled people’s votes in the 2016 EU Referendum and the 2017 General Election, I have created, using the just released British Election Study wave 19 data.
I’m hoping to dig into this dataset more in the coming weeks (along with everyone else interested in UK politics), and produce some more consistent comparisons with previous elections but in the meantime, here’s my quick and dirty, written from a Parisian cafe analysis of how disabled people voted in the 2019 general election.
This time I’ve used a slightly more sophisticated methodology, using the multinom() regression function from the nnet R package. I’ve also included country (England, Scotland or Wales), age, age squared, university education and National Statistics Socio-economic classification analytic classes based on Standard Occupational Classifications 2010 (SOC2010).
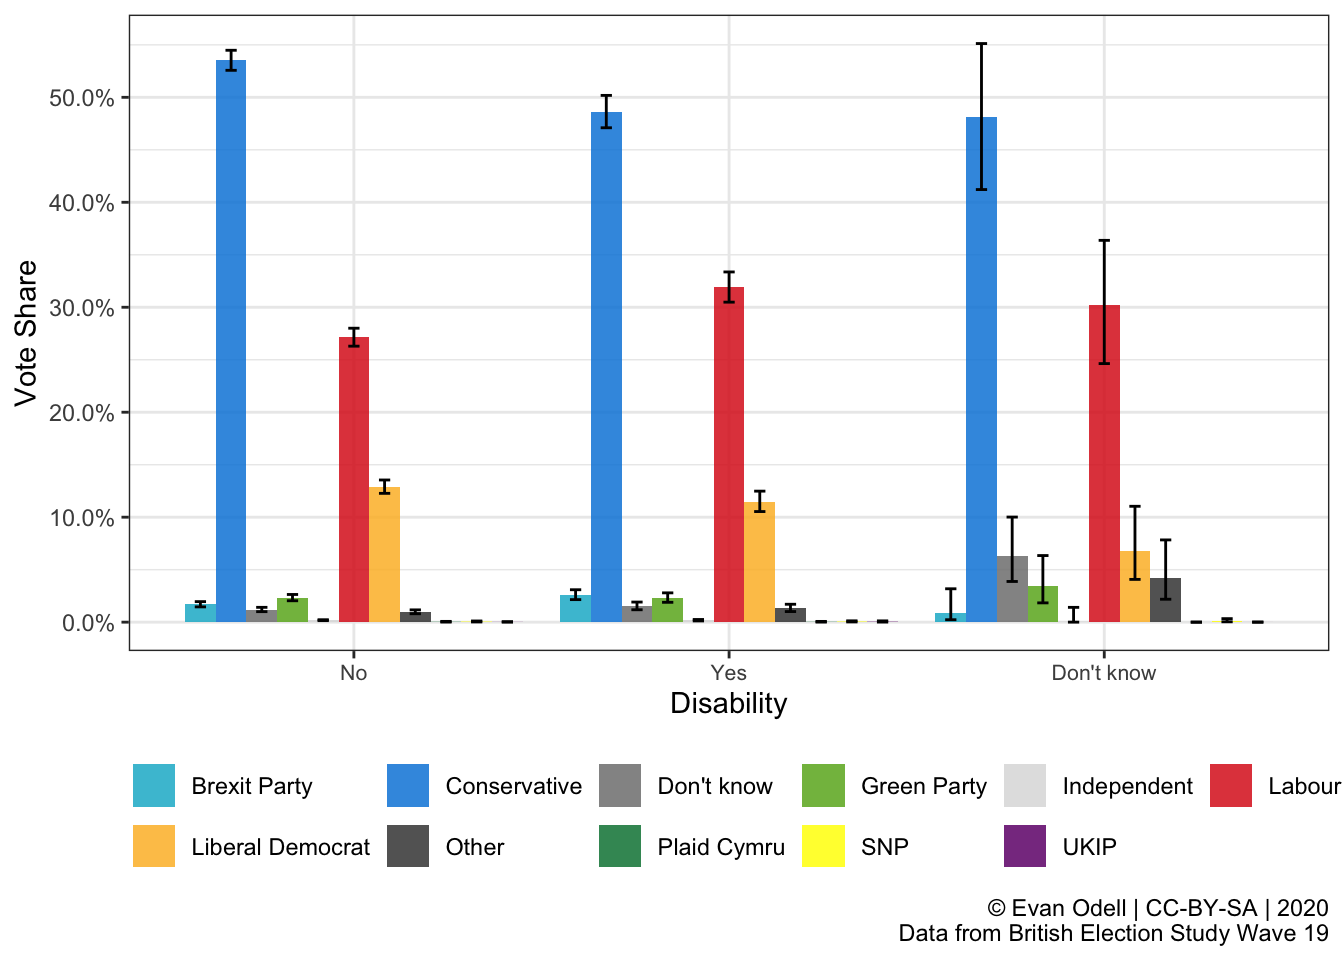
This plot summarises those effects:
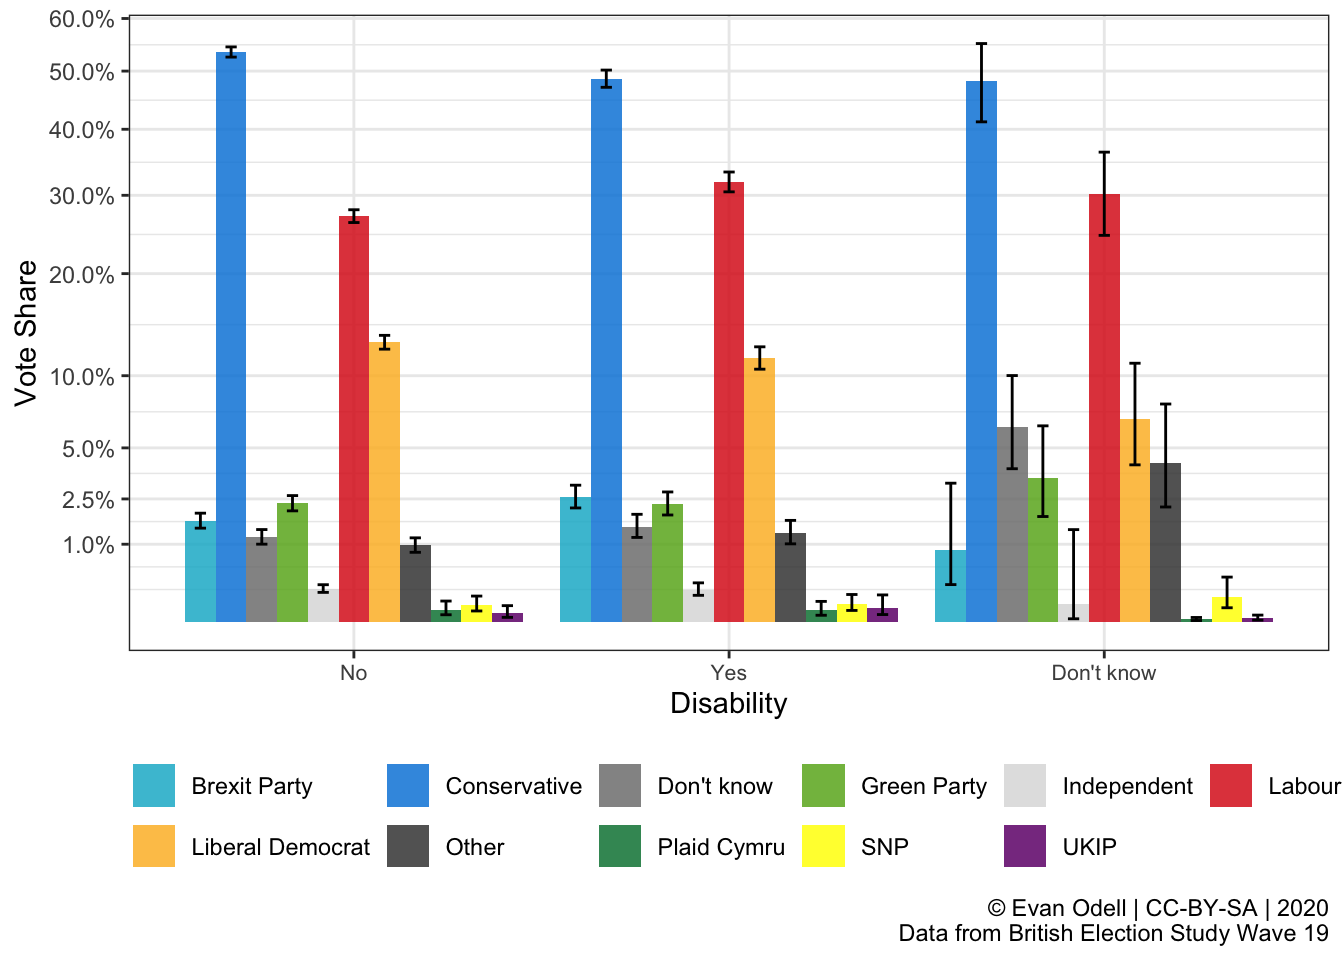
I’ve also created a second plot with a transformed scale to better show the voting trends for smaller and regional parties.
Based on this, it seems that disabled people did disproportionately vote for the Labour party compared to the overall population, although not by a huge margin, compared to non-disabled people.
Going forward I’m hoping to take a look at disabled people’s values and ideological positioning, as well as apply this method to previous general elections.
My code is, as always, available on GitHub.